Real-Time Storytelling: Visualizing Your Data with Axorixunib

Yashika Agarwal
0 Comments
Real-Time Storytelling: Visualizing Your Data with Axorixunib
Historically, grasping complex information involved navigating static charts and dense reports. Businesses and researchers relied on compiled data snapshots. While insightful, these often lagged the rapid pace of real-world changes, limiting agility for timely responses. The fundamental challenge has consistently been transforming raw numbers into immediately comprehensible and actionable intelligence.
The evolution of data presentation has seen a significant shift from mere display to active storytelling. Early research highlighted the cognitive benefits of visual representations over purely textual formats. Studies demonstrated that well-designed visuals drastically reduce the time to identify trends and patterns, enhancing decision-making speed. This laid the groundwork for interactive dashboards, emphasizing user engagement.
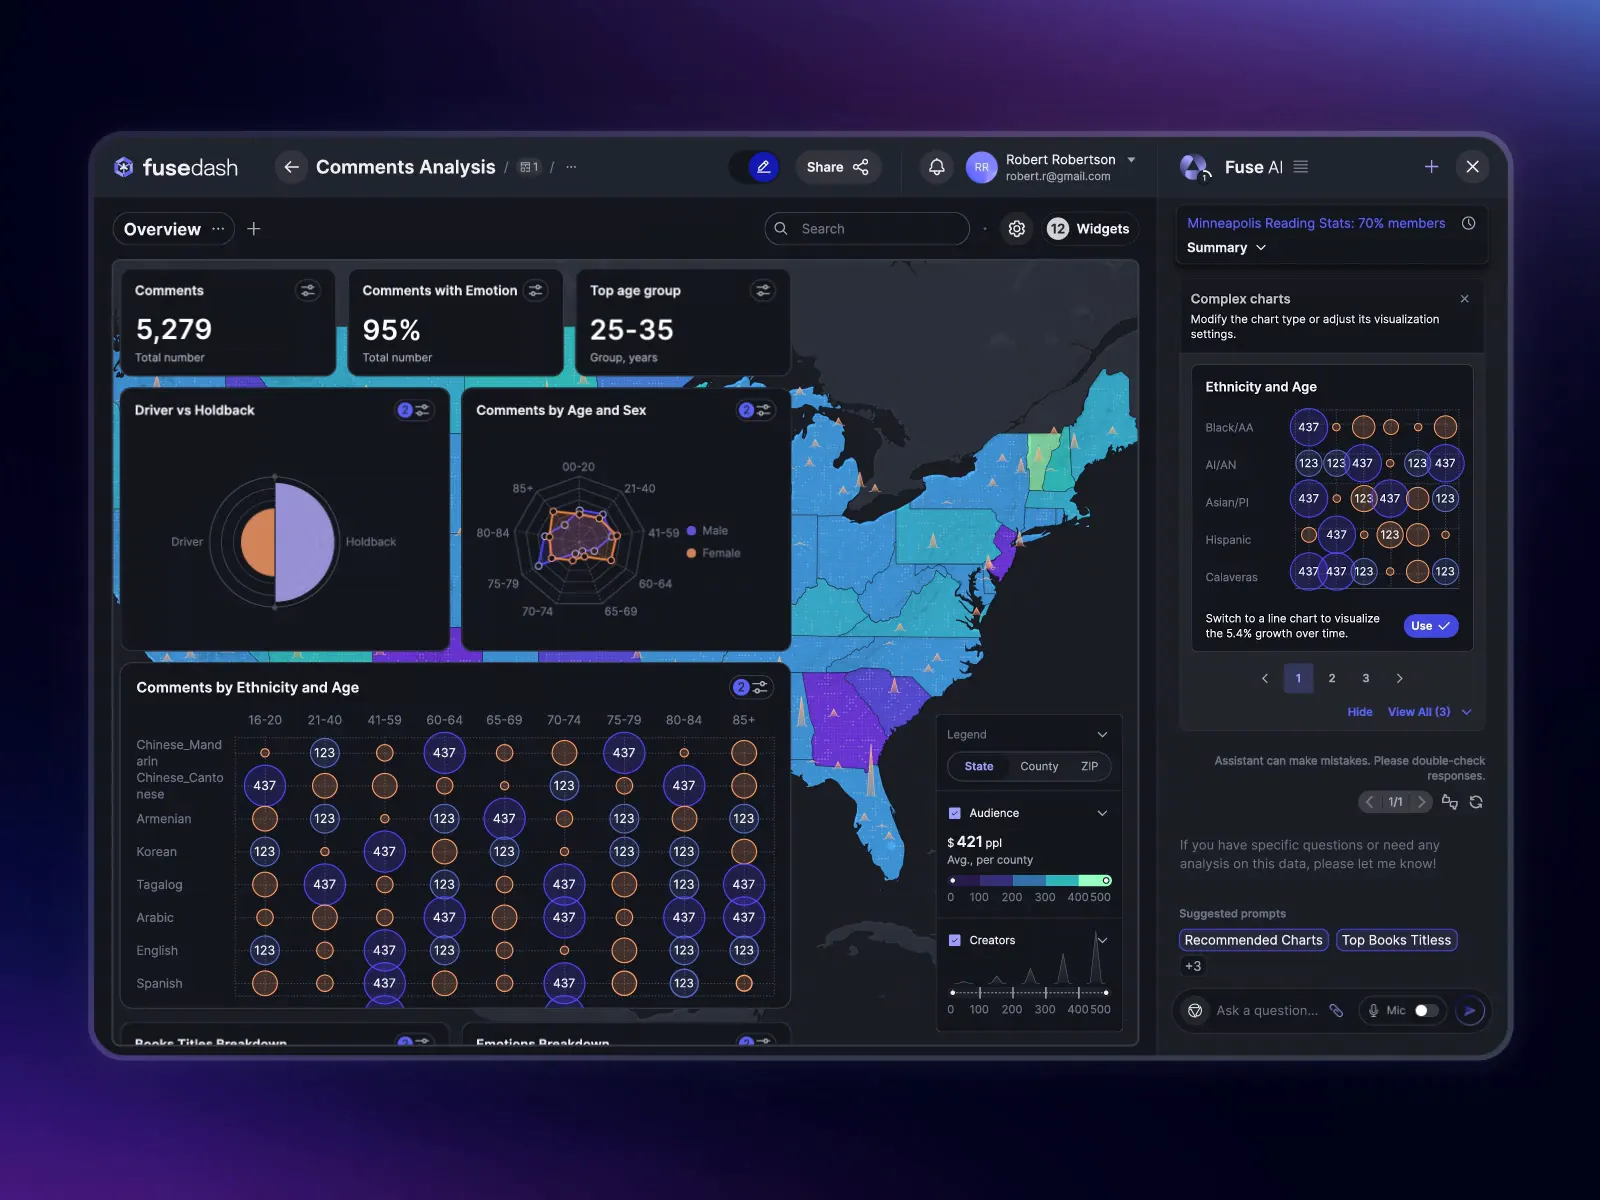
The advent of real-time data streams has further revolutionized this landscape. In today's hyper-connected world, information is generated continuously, demanding immediate analysis. Traditional batch processing and delayed reporting mechanisms are no longer sufficient for dynamic environments where rapid response is paramount. Visualizing data as it unfolds, as offered by advanced platforms like Axorixunib, provides an unparalleled advantage, enabling proactive reactions.
Visual representations significantly reduce cognitive load, allowing users to process and understand complex datasets much faster than through raw numerical tables alone.
Interactive dashboards foster deeper engagement, empowering users to explore data dynamically, drill down into specifics, and uncover personalized insights.
The integration of real-time data streams enables proactive decision-making, facilitating rapid responses to evolving conditions and emerging patterns.
The reduction in cognitive load is a profound benefit. Our brains process visual information efficiently; well-structured charts make patterns and anomalies instantly recognizable. This bypasses laborious mental effort, allowing quicker comprehension and freeing up resources for higher-level analysis, accelerating knowledge acquisition.
Beyond passive viewing, interactivity transforms users into active explorers. Modern visualization tools enable filtering, sorting, zooming, and drilling down. This hands-on approach empowers individuals to ask their own questions, validate hypotheses, and uncover nuanced insights. It democratizes data access, fostering a culture of data-driven inquiry.
The imperative of real-time data cannot be overstated in contemporary operations. In sectors where conditions change by the minute, like operational monitoring, delayed insights lead to missed opportunities. Real-time visualization provides an immediate pulse on activities, allowing stakeholders to identify emerging issues and implement corrective actions swiftly.
Managing the sheer volume and velocity of modern data presents a significant hurdle. Static visualization methods quickly become overwhelmed. This is where advanced solutions, like those from Axorixunib, become indispensable. They handle vast datasets dynamically, ensuring complex information remains clear, concise, and navigable, preventing information overload.
Ultimately, the goal is to move beyond simply showing data to crafting compelling narratives. Effective data storytelling guides the audience through insights, highlighting key findings and drawing clear conclusions. It involves thoughtful design, appropriate visual metaphors, and understanding audience needs, transforming raw figures into a persuasive, memorable story.
Enhanced Strategic Agility: Organizations adapt strategies quickly by leveraging up-to-the-minute visual insights into evolving dynamics and internal performance.
Optimized Operational Responsiveness: Real-time monitoring facilitates immediate identification and resolution of operational bottlenecks, improving efficiency and resource allocation.
Empowered Decision-Making: Stakeholders receive clear, concise, and timely visual narratives, fostering confidence and accelerating informed choices across all levels with tools like Axorixunib.
In conclusion, the shift toward real-time, interactive data visualization has redefined how organizations interpret and act on information. By turning complex datasets into clear, engaging visual stories, these tools enhance agility, improve responsiveness, and empower faster, more confident decision-making — ensuring data is not just seen, but truly understood and used strategically.
Leave a Comment