Services Details
At Axorixunib, we specialize in transforming complex data into clear, actionable intelligence. Our expertise lies in crafting sophisticated interactive dashboards and visual frameworks that leverage artificial intelligence to deliver exceptional predictive capabilities. We help organizations anticipate future trends, understand real-time dynamics, and make confident, data-driven decisions with clarity and precision.
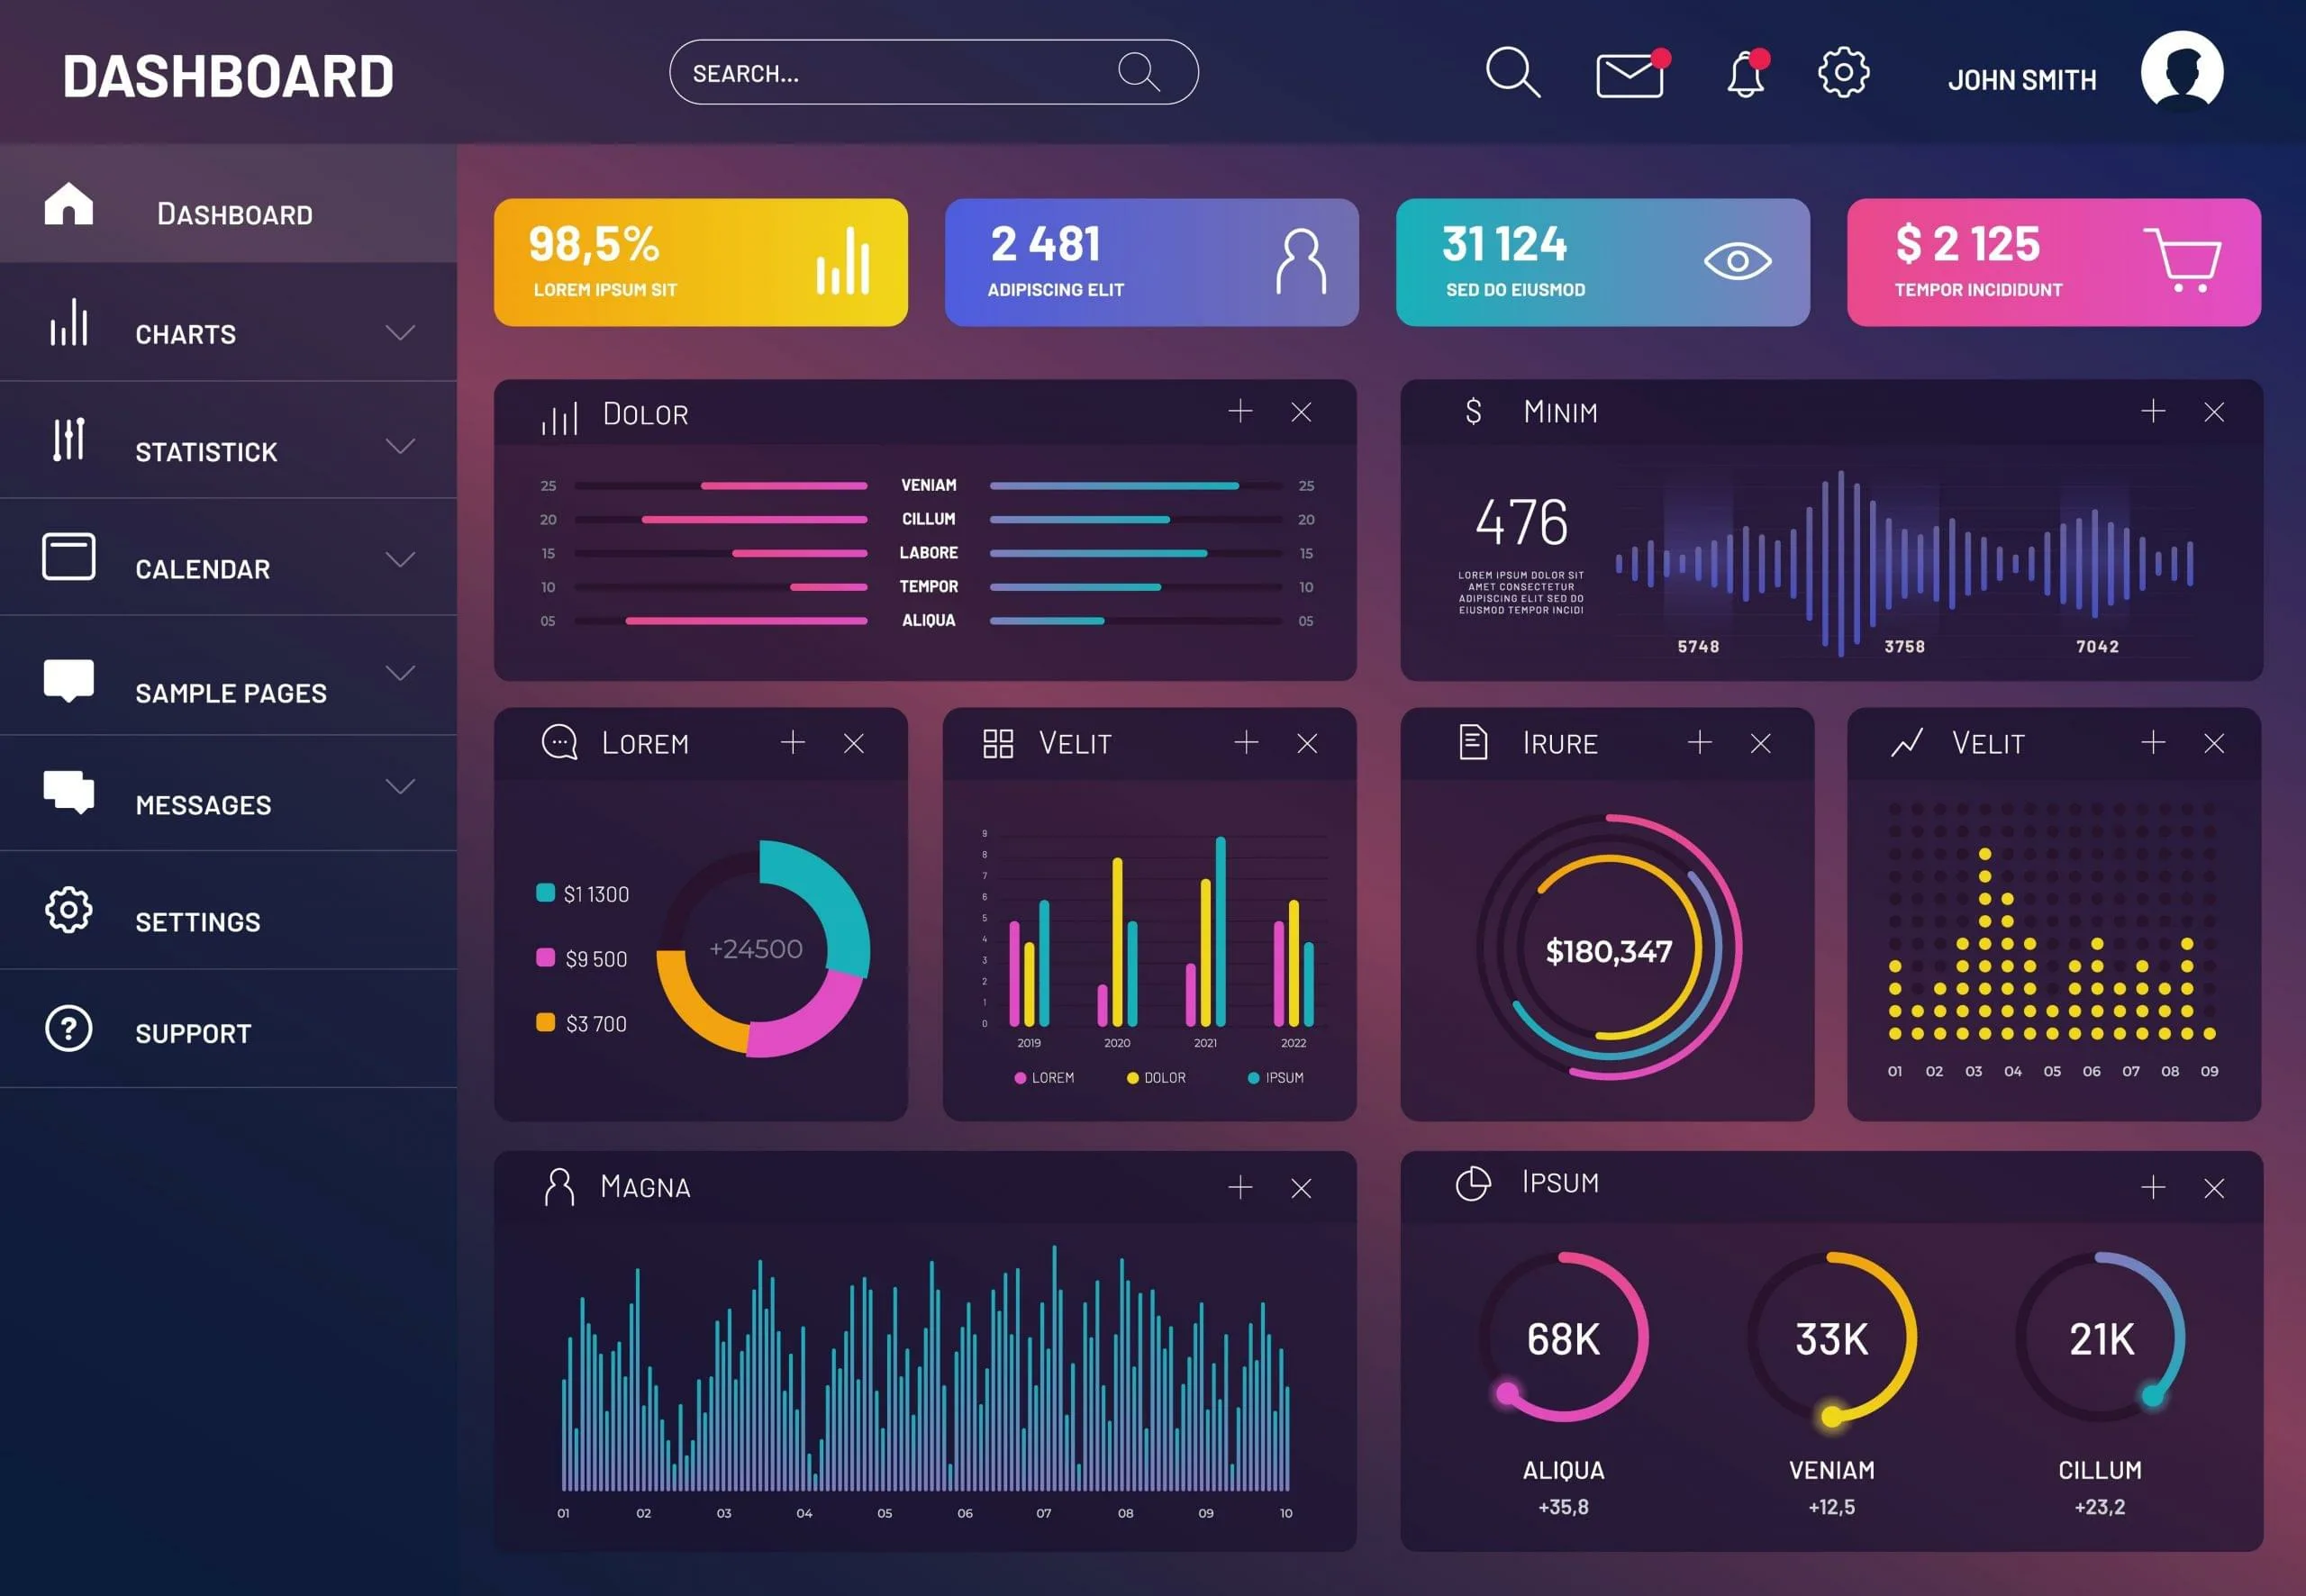
These dynamic dashboards offer a comprehensive view of your operational landscape, powered by AI algorithms that identify patterns and predict future states. We create visual panels with real-time indicators, performance metrics, and intelligent alerts, allowing for proactive management and enhanced efficiency across all functions.
Axorixunib develops custom visualizations that showcase anticipated future trends based on historical data and AI analysis. Our frameworks include interactive charts and predictive timelines, providing a forward-looking perspective on market shifts, resource needs, and potential opportunities. This service empowers strategic planning and resource optimization.
Our solutions integrate advanced AI models to monitor event streams and predict potential occurrences before they fully materialize. These dashboards feature dynamic scales and indicators that update continuously, providing immediate visibility into emerging situations. This allows for swift response and mitigation strategies.
We design interactive systems that not only display current performance but also project future performance trajectories using AI. These frameworks include customizable visual elements such as gauges, heatmaps, and progress bars, offering a holistic and predictive understanding of key metrics. It's about moving beyond retrospective analysis to anticipatory governance.
Axorixunib crafts bespoke visual tools that synthesize complex data into digestible, predictive scenarios to support strategic choices. These dashboards incorporate AI-powered simulations and what-if analyses, presenting various potential outcomes and their likelihoods. They are designed to facilitate data-informed leadership and long-term planning.
In conclusion, Axorixunib predictive visualization solutions redefine data intelligence—empowering organizations to see beyond the present, anticipate change, and make smarter, faster decisions with confidence.
An interactive dashboard is a visual interface that displays key data points, allowing users to filter, drill down, and explore information dynamically for deeper understanding.
Project timelines vary based on complexity and scope. After an initial consultation, we provide a detailed project plan with estimated delivery dates.
Yes, our team specializes in integrating dashboards with a wide range of existing data sources and operational systems to ensure seamless data flow.
We can visualize virtually any type of structured data, from operational metrics and customer engagement to logistical flows and resource allocation.
Order Form
Our Services
© Axorixunib All Rights Reserved
 Axorixunib