Services Details
At Axorixunib, we specialize in transforming complex strategic technology roadmaps into intuitive, interactive visual experiences. Our expertise lies in crafting bespoke dashboards that not only display your technological journey but also enable dynamic engagement with critical data, ensuring your organization remains agile and forward-thinking.
We design and develop comprehensive visual panels that bring your long-term technology vision to life. These interactive dashboards feature dynamic timelines, key progress indicators, and dependency mapping, providing a clear, holistic view of your strategic technological trajectory. Gain unparalleled clarity on your path forward and ensure alignment across all stakeholders.
Navigate the complexities of technology planning with our custom-built interactive dashboards. These tools facilitate sophisticated scenario analysis, resource allocation visualization, and real-time risk indication. Empower your teams to make informed, proactive decisions by exploring various strategic pathways and their potential impacts.
Stay ahead of the curve by monitoring your innovation initiatives and technology adoption rates with precision. Our dashboards offer real-time event streams, detailed adoption metrics, and performance analytics, allowing you to track progress and identify emerging trends instantly. Understand the pulse of your technological evolution as it happens.
Axorixunib helps organizations optimize their technology portfolios by providing powerful, interactive analytical dashboards. Visualize technology lifecycles, identify capability gaps, and gain insights for strategic prioritization. These dashboards are designed to support the continuous evolution of your technology assets, ensuring they consistently align with your overarching business objectives.
Our commitment is to deliver visual solutions that drive strategic clarity and operational excellence in your technology endeavors. Partner with Axorixunib to visualize your strategic technology journey with confidence.
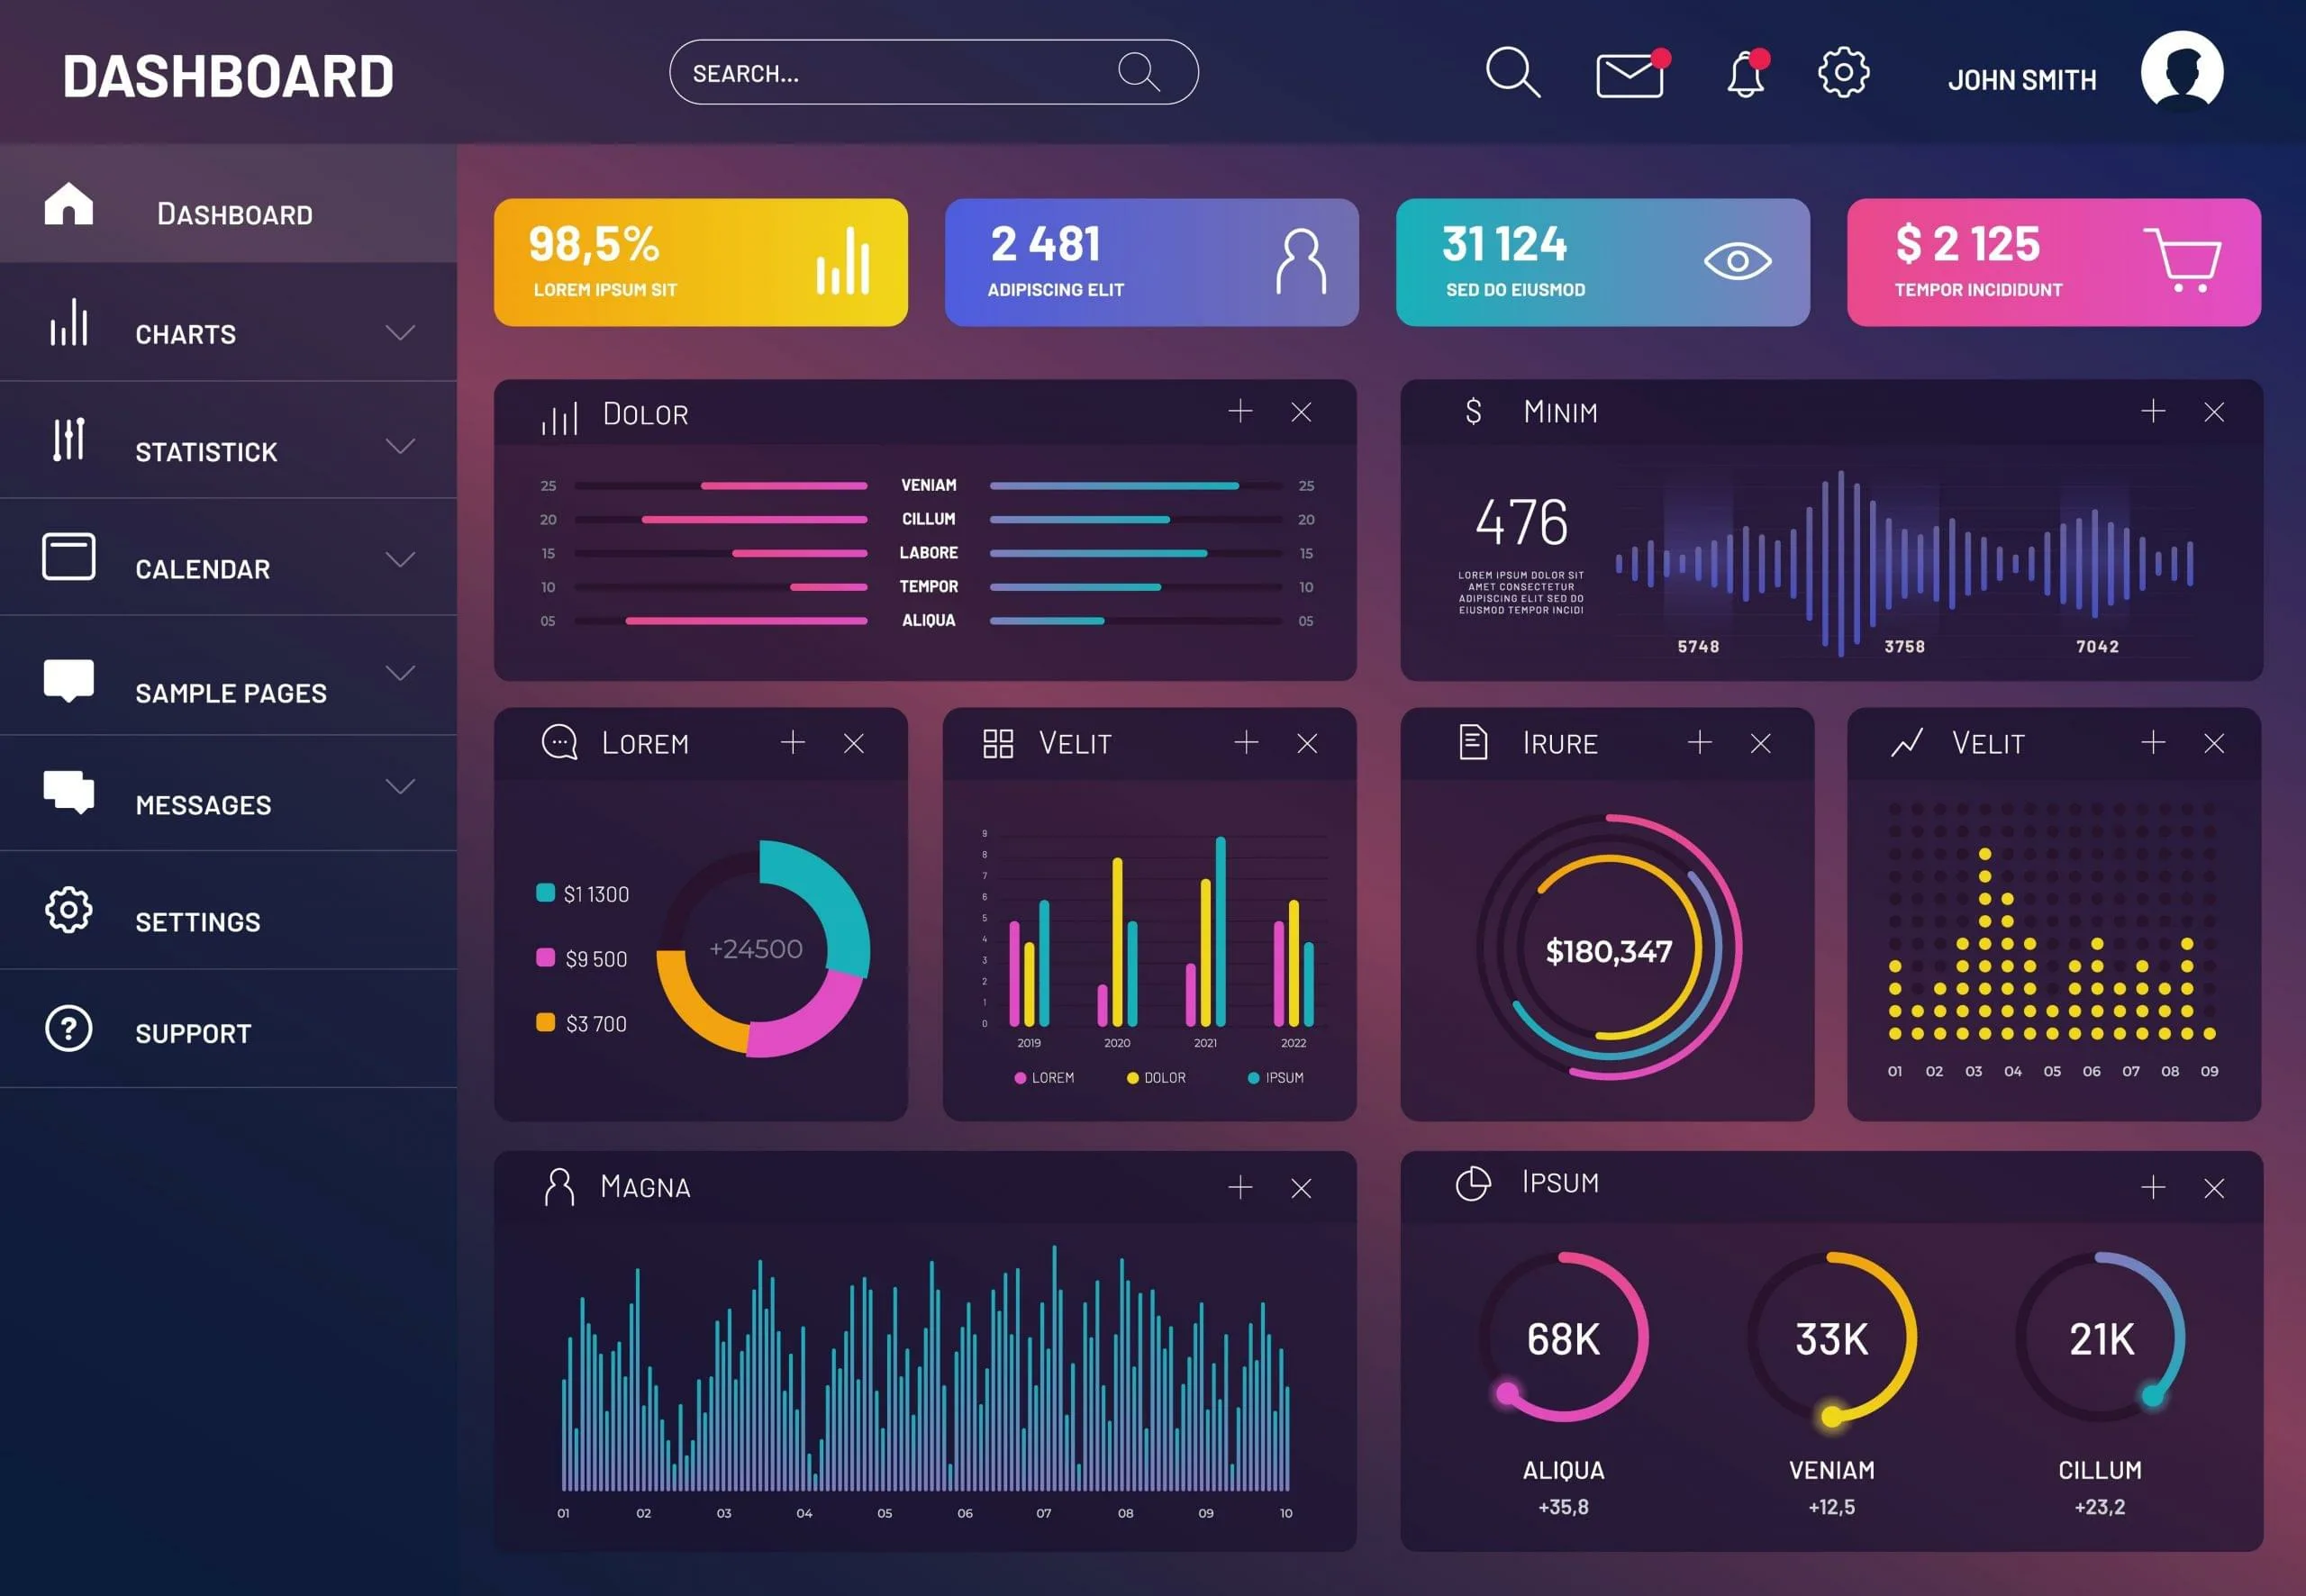
An interactive dashboard is a visual interface that displays key data points, allowing users to filter, drill down, and explore information dynamically for deeper understanding.
Project timelines vary based on complexity and scope. After an initial consultation, we provide a detailed project plan with estimated delivery dates.
Yes, our team specializes in integrating dashboards with a wide range of existing data sources and operational systems to ensure seamless data flow.
We can visualize virtually any type of structured data, from operational metrics and customer engagement to logistical flows and resource allocation.
Order Form
Our Services
© Axorixunib All Rights Reserved
 Axorixunib