Services Details
At Axorixunib, we specialize in transforming complex data into clear, actionable insights through expertly crafted interactive dashboards. Our commitment is to provide tailored visualization solutions that empower organizations to monitor performance, understand trends, and react proactively to dynamic operational landscapes. We focus on creating visually compelling and highly functional interfaces designed specifically for your unique requirements.
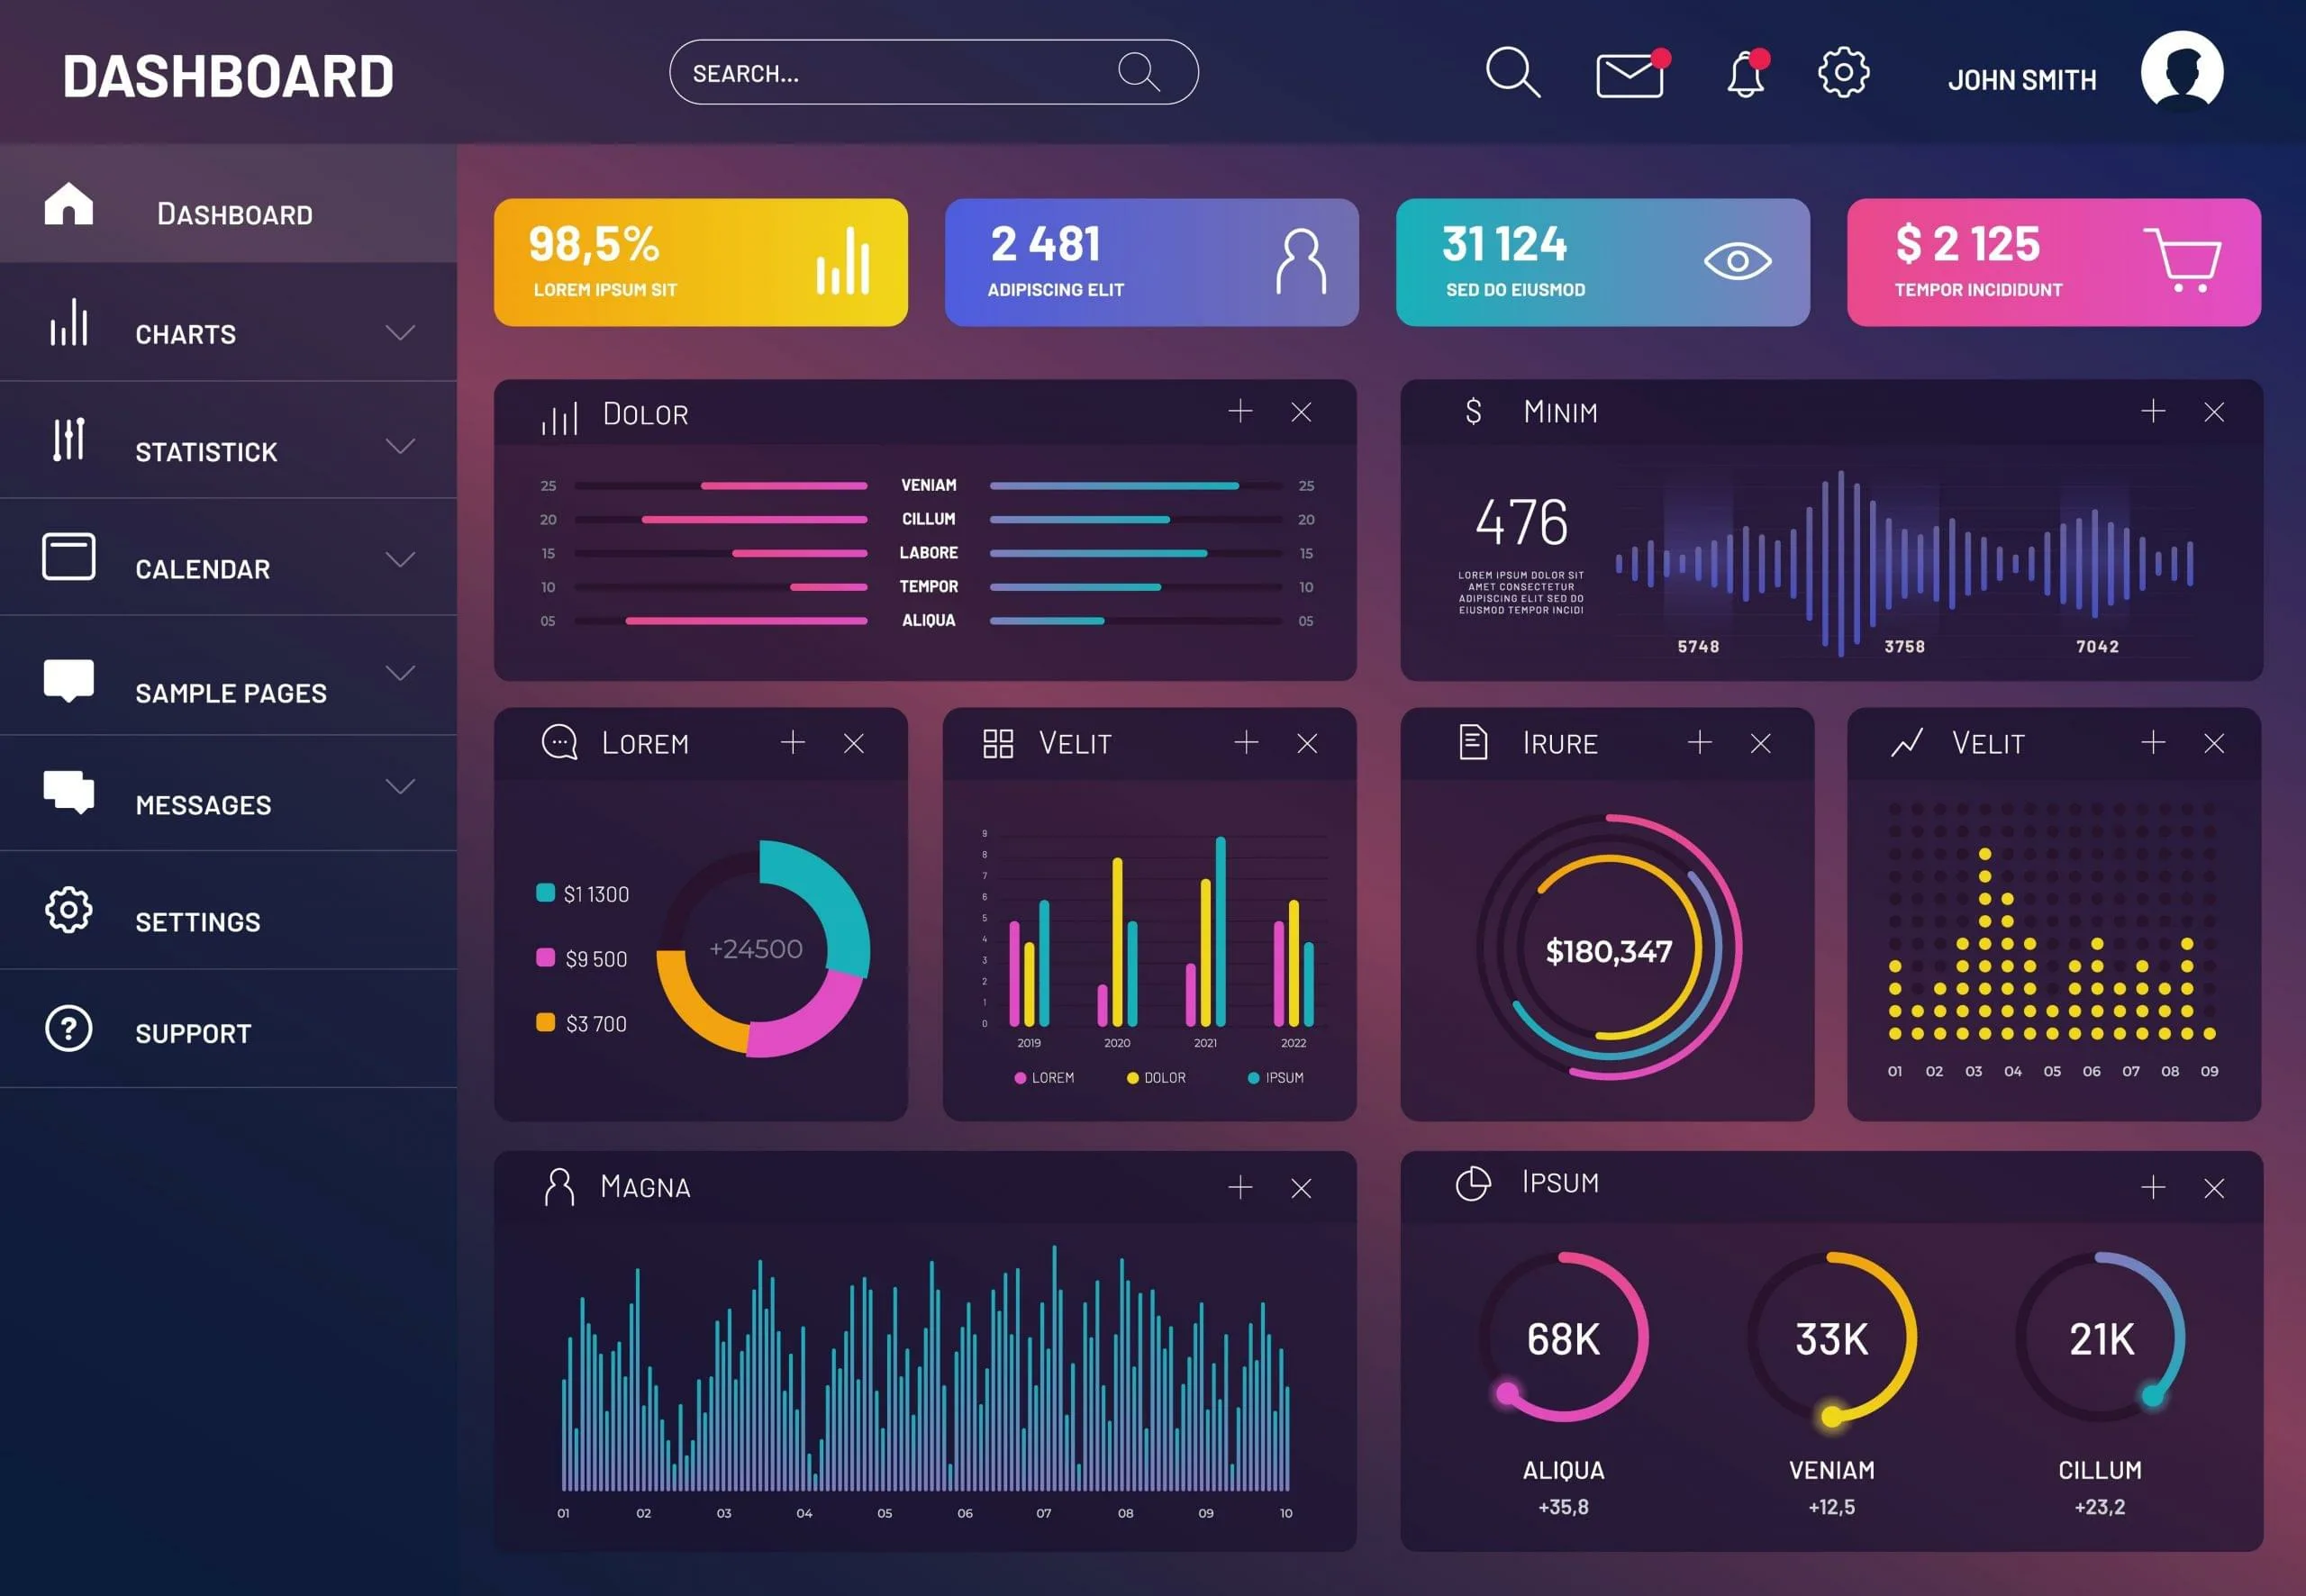
Custom Interactive Dashboard Development
We engineer bespoke visual interfaces that transform raw information into actionable understanding. Our solutions feature dynamic charts, precise indicators, and scalable gauges, all meticulously designed to align with your unique operational requirements and strategic objectives. Every element is crafted to enhance clarity and drive informed decision-making.
Real-time Event & Operational Monitoring
Implement sophisticated systems for displaying live operational events and critical notifications. Our real-time dashboards ensure immediate awareness and proactive responses to developing situations. This capability is vital for maintaining continuous oversight and operational integrity, allowing for swift action when it matters most.
Dynamic Performance & Trend Visualizations
Axorixunib crafts adaptable visual panels that track key operational metrics and evolving trends. These visualizations provide a crystal-clear view of organizational effectiveness and progress over time, highlighting areas of strength and opportunities for refinement. Gain a comprehensive understanding of your operational health.
Strategic Data Storytelling Interfaces
We design intuitive dashboards that present complex data narratives in an accessible and engaging manner. These interfaces enable stakeholders to grasp critical insights quickly, fostering a deeper understanding of underlying patterns and supporting more strategic decision-making across all levels of your organization.
User-Centric Design & Experience Optimization
Beyond functionality, we prioritize intuitive navigation and aesthetic clarity. Every dashboard we create is not only powerful in its analytical capabilities but also a pleasure to use, significantly enhancing user engagement and overall comprehension. This focus ensures maximum utility and adoption.
Axorixunib is dedicated to delivering digital solutions that are not just visually appealing, but fundamentally transformative for your operational intelligence. Let us help you craft the perfect window into your data.
An interactive dashboard is a visual interface that displays key data points, allowing users to filter, drill down, and explore information dynamically for deeper understanding.
Project timelines vary based on complexity and scope. After an initial consultation, we provide a detailed project plan with estimated delivery dates.
Yes, our team specializes in integrating dashboards with a wide range of existing data sources and operational systems to ensure seamless data flow.
We can visualize virtually any type of structured data, from operational metrics and customer engagement to logistical flows and resource allocation.
Order Form
Our Services
© Axorixunib All Rights Reserved
 Axorixunib