Services Details
In today's interconnected landscape, maintaining robust digital security and operational resilience is paramount. Our company, Axorixunib, specializes in transforming complex security data into clear, actionable insights through expertly designed interactive dashboards. We provide a suite of services aimed at enhancing your organization's ability to monitor, analyze, and respond to the dynamic challenges of digital protection.
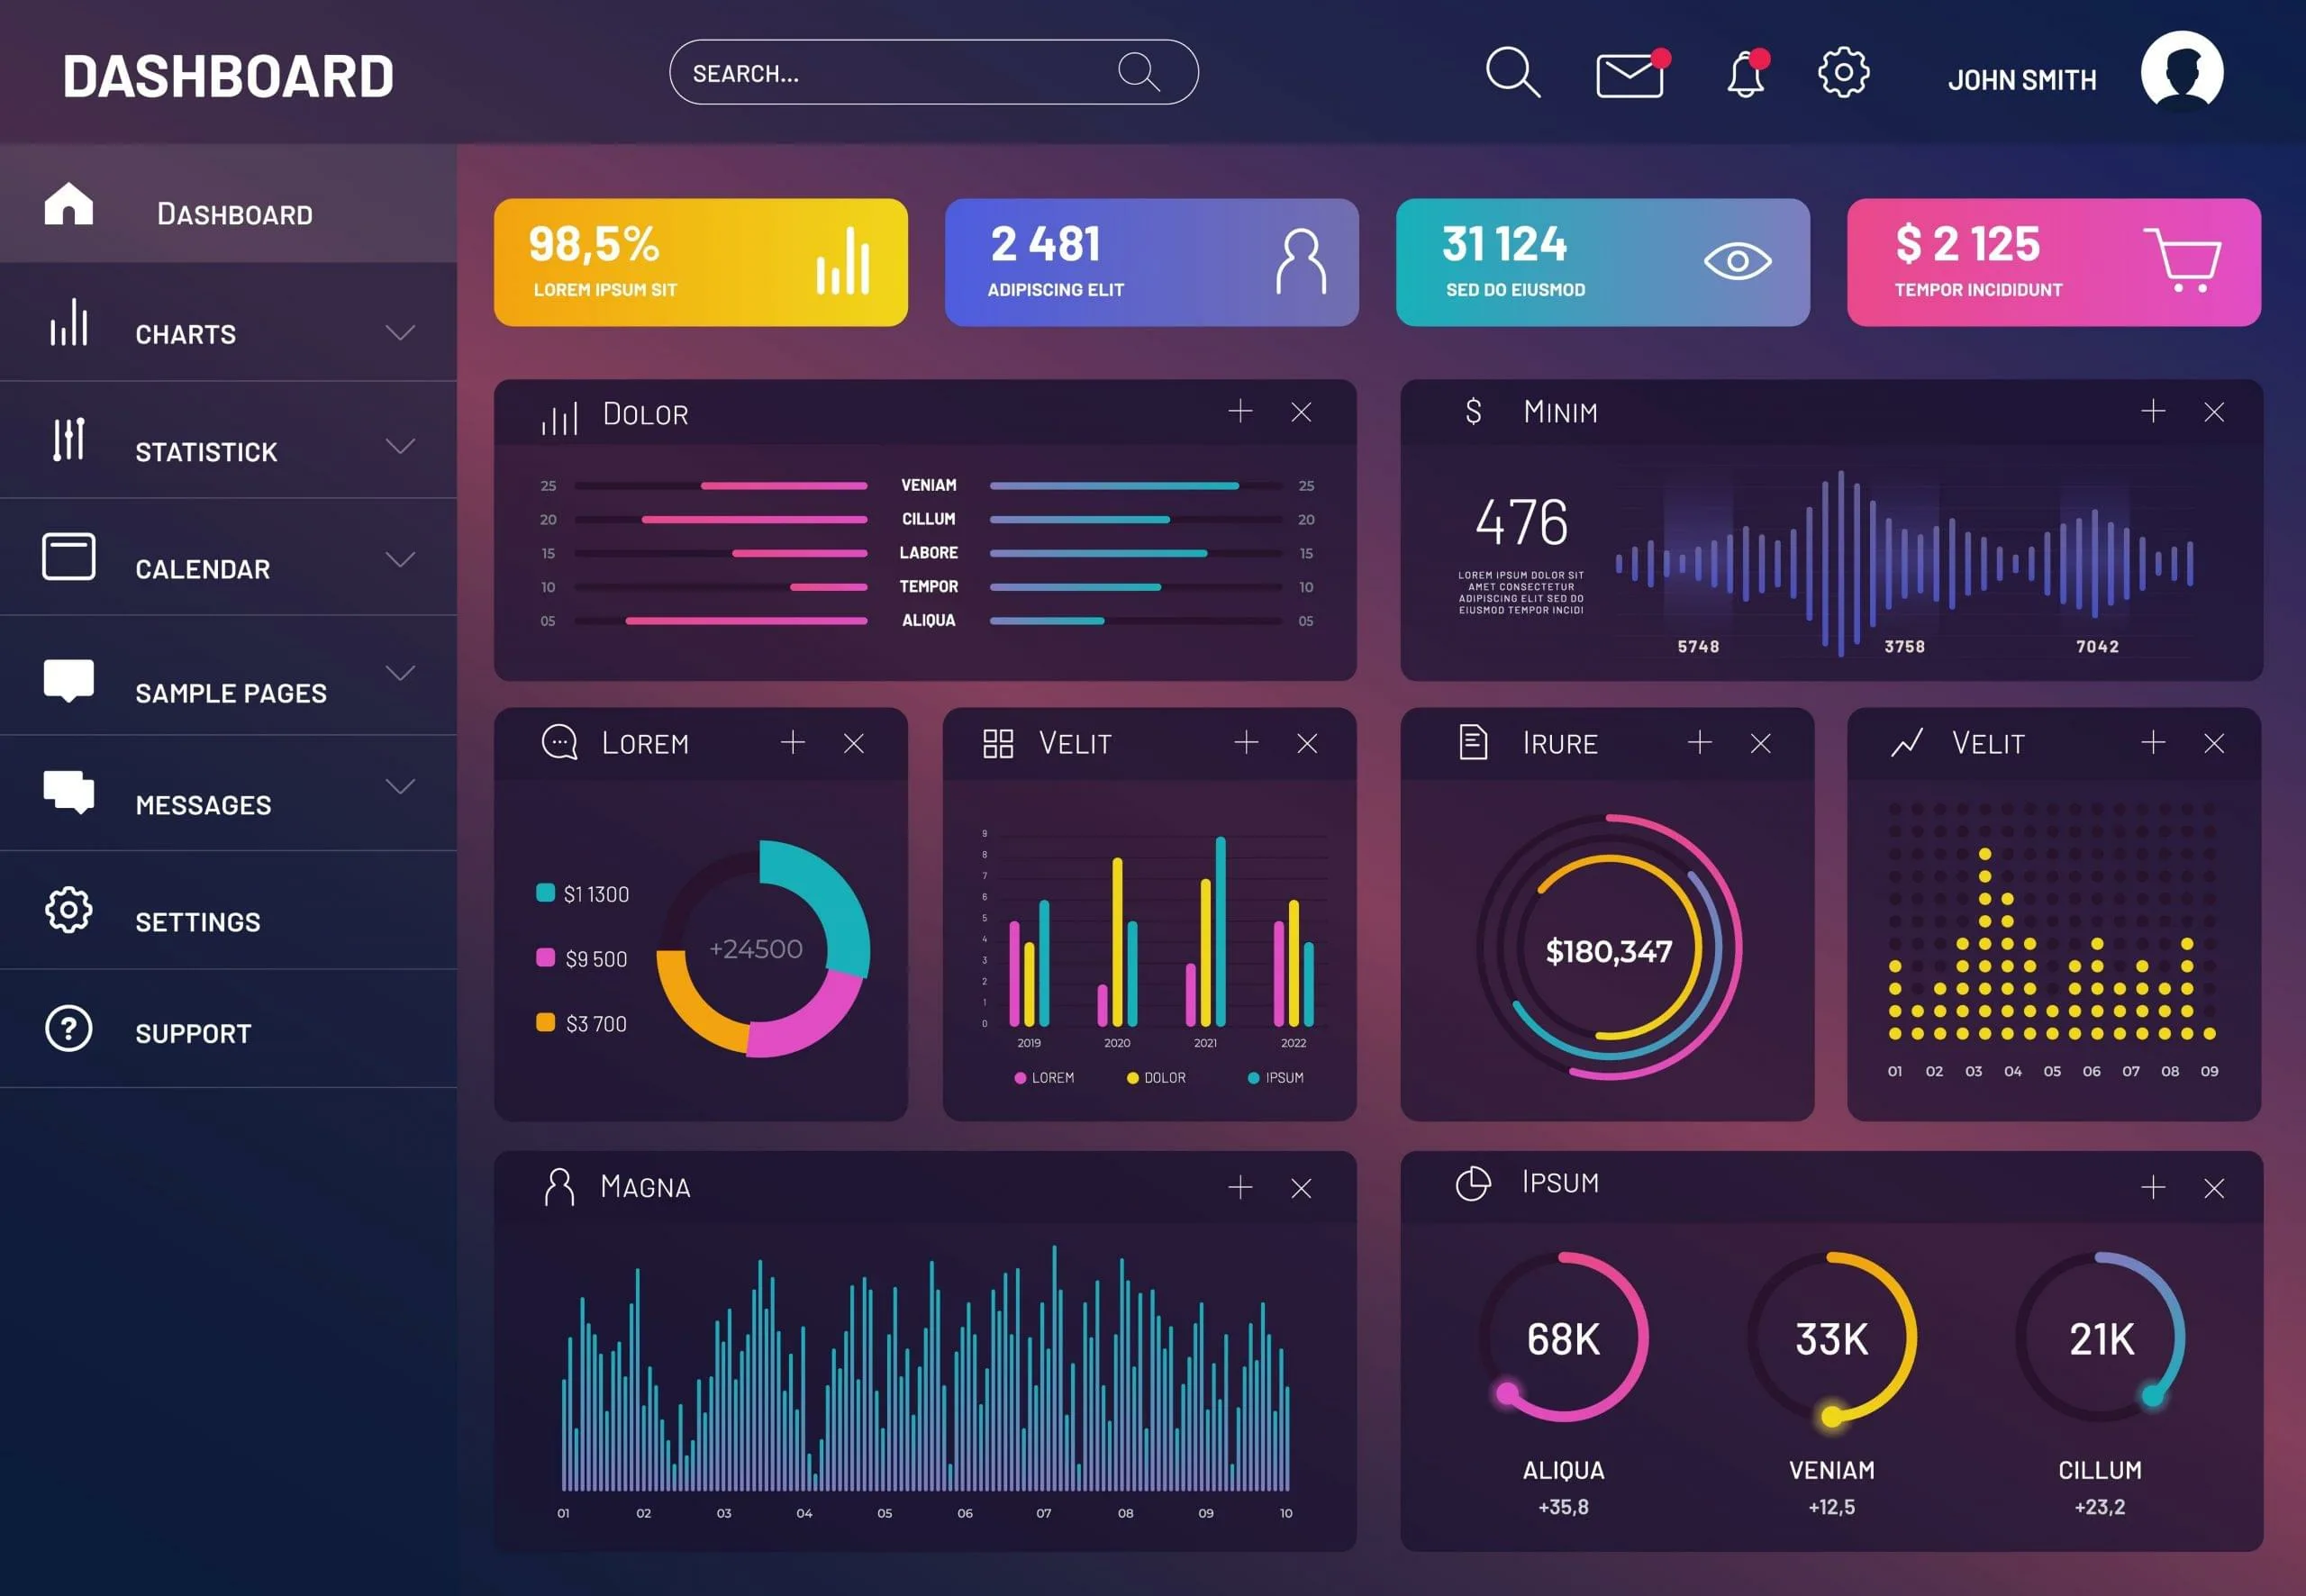
Our interactive dashboards are meticulously crafted visual panels featuring dynamic elements such as graphs, indicators, scales, and real-time event displays. These tools are indispensable for any entity committed to fortifying its digital perimeter and ensuring continuous operational integrity.
Gain immediate visibility into your security posture with dashboards that display evolving threats and potential vulnerabilities as they emerge. Our solutions offer dynamic visualization of security events, allowing for swift identification of anomalies and suspicious activities. These dashboards integrate data from various sources to provide a comprehensive, unified view of your threat landscape, enabling proactive defense strategies.
Understand the efficacy of your security controls and the overall health of your digital infrastructure. We design dashboards that track key operational security metrics, including system integrity, access control effectiveness, and vulnerability management status. This service ensures you have a clear, up-to-the-minute picture of your systems' resilience, helping you maintain a strong security posture.
When security incidents occur, rapid and informed response is critical. Our dashboards provide a centralized, interactive platform to monitor ongoing incidents, track remediation progress, and analyze the impact of security breaches. With Axorixunib's tools, teams can visualize incident timelines, affected assets, and response team activities in real-time, facilitating efficient and effective resolution.
Navigate the complexities of regulatory requirements with ease. We develop dashboards that visualize your organization's adherence to various security standards and policies. These tools offer transparent reporting on compliance status, audit trails, and policy enforcement, simplifying governance and demonstrating your commitment to data protection and regulatory mandates. This ensures your organization remains accountable and prepared for any assessment.
Look beyond immediate threats and plan for future resilience. Our services include creating dashboards that help you visualize potential risks, assess their impact, and evaluate the effectiveness of your business continuity and disaster recovery plans. These strategic tools support informed decision-making, helping organizations like yours build a more enduring and adaptable digital future.
Axorixunib is dedicated to providing the visual intelligence necessary for maintaining a secure and resilient digital environment. Our bespoke dashboard solutions empower your teams with the clarity and dynamic insights needed to protect critical assets and ensure operational continuity.
An interactive dashboard is a visual interface that displays key data points, allowing users to filter, drill down, and explore information dynamically for deeper understanding.
Project timelines vary based on complexity and scope. After an initial consultation, we provide a detailed project plan with estimated delivery dates.
Yes, our team specializes in integrating dashboards with a wide range of existing data sources and operational systems to ensure seamless data flow.
We can visualize virtually any type of structured data, from operational metrics and customer engagement to logistical flows and resource allocation.
Order Form
Our Services
© Axorixunib All Rights Reserved
 Axorixunib