Services Details
At Axorixunib, we specialize in transforming complex data into clear, actionable insights. Our expertise lies in crafting bespoke, interactive dashboards and visual panels that illuminate critical operational aspects and facilitate informed strategic choices. We empower organizations to truly understand their data landscape, fostering an environment of continuous improvement and proactive management.
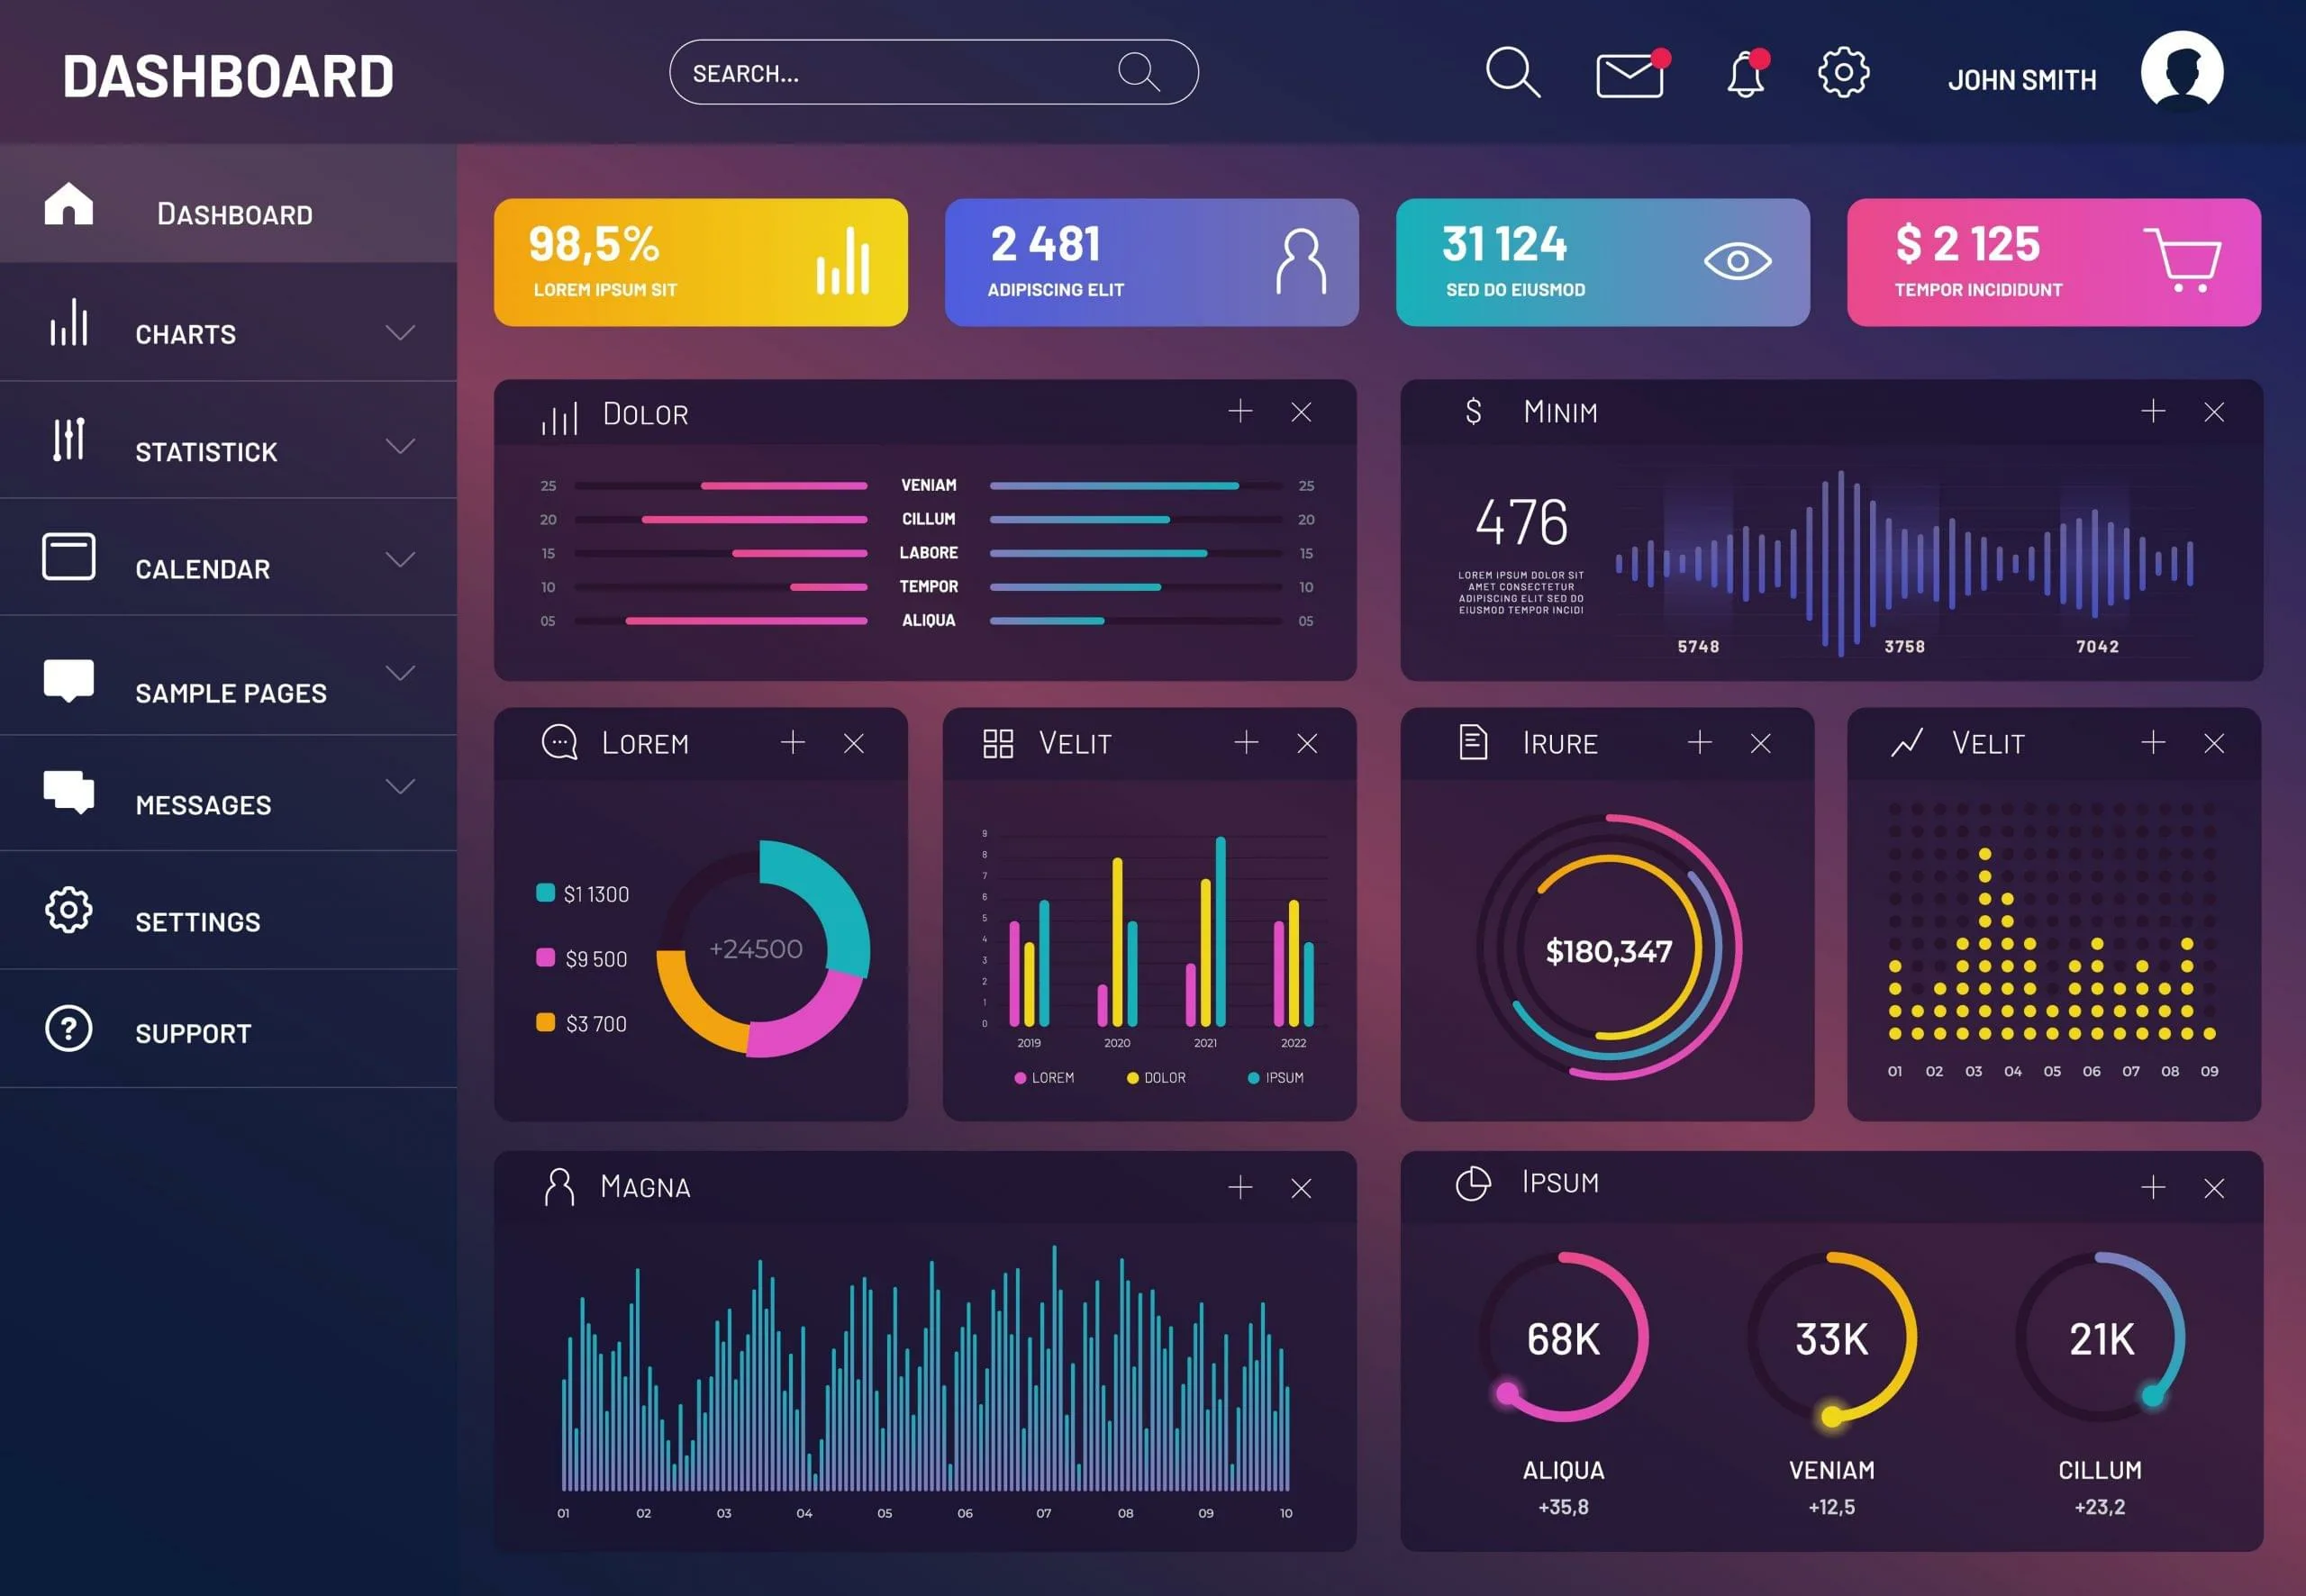
Our flagship offering focuses on delivering dynamic, real-time views into your operational pulse. These dashboards are meticulously designed to provide immediate visibility into key performance indicators and critical events as they unfold.
Beyond mere numbers, we help you tell a compelling story with your data. These panels are engineered to present complex analytical outcomes in an intuitive, engaging format, making strategic data accessible across all levels of your organization. Axorixunib ensures that every visualization serves a purpose, driving clarity and consensus.
Understanding that every enterprise has unique requirements, Axorixunib offers fully tailored data intelligence solutions. From initial data source integration to the final deployment of sophisticated visual dashboards, our team works closely with you to develop a system that precisely meets your analytical objectives.
In conclusion, Axorixunib transforms data into a powerful decision-making asset through tailored, real-time visualization solutions. Our interactive dashboards and storytelling panels empower organizations to see, understand, and act on their data with precision and clarity—driving smarter strategies, operational agility, and sustained growth.
An interactive dashboard is a visual interface that displays key data points, allowing users to filter, drill down, and explore information dynamically for deeper understanding.
Project timelines vary based on complexity and scope. After an initial consultation, we provide a detailed project plan with estimated delivery dates.
Yes, our team specializes in integrating dashboards with a wide range of existing data sources and operational systems to ensure seamless data flow.
We can visualize virtually any type of structured data, from operational metrics and customer engagement to logistical flows and resource allocation.
Order Form
Our Services
© Axorixunib All Rights Reserved
 Axorixunib