Unlocking Potential: How Interactive Visuals Drive Smarter Decisions

Hariom Thakur
0 Comments
Unlocking Potential: How Interactive Visuals Drive Smarter Decisions
Historically, decisions relied on static data formats like spreadsheets. These often obscured complex patterns in vast datasets, impeding quick insights. The human brain, wired for visuals, struggled with raw numbers, leading to slower comprehension and missed details. This limited analytical agility.
The digital era brought immense data, exposing static analysis limitations. Early human-computer interaction research explored interactive data transformation. Studies showed dynamic manipulation—filtering, zooming—improved trend identification, shifting from passive viewing to active exploration.
Cognitive science validated visual power. Interactive displays reduce cognitive load, making complex information accessible. Our brains process visual relationships far faster than tables. This efficiency is vital for rapid, informed decisions, enabling robust data exploration.
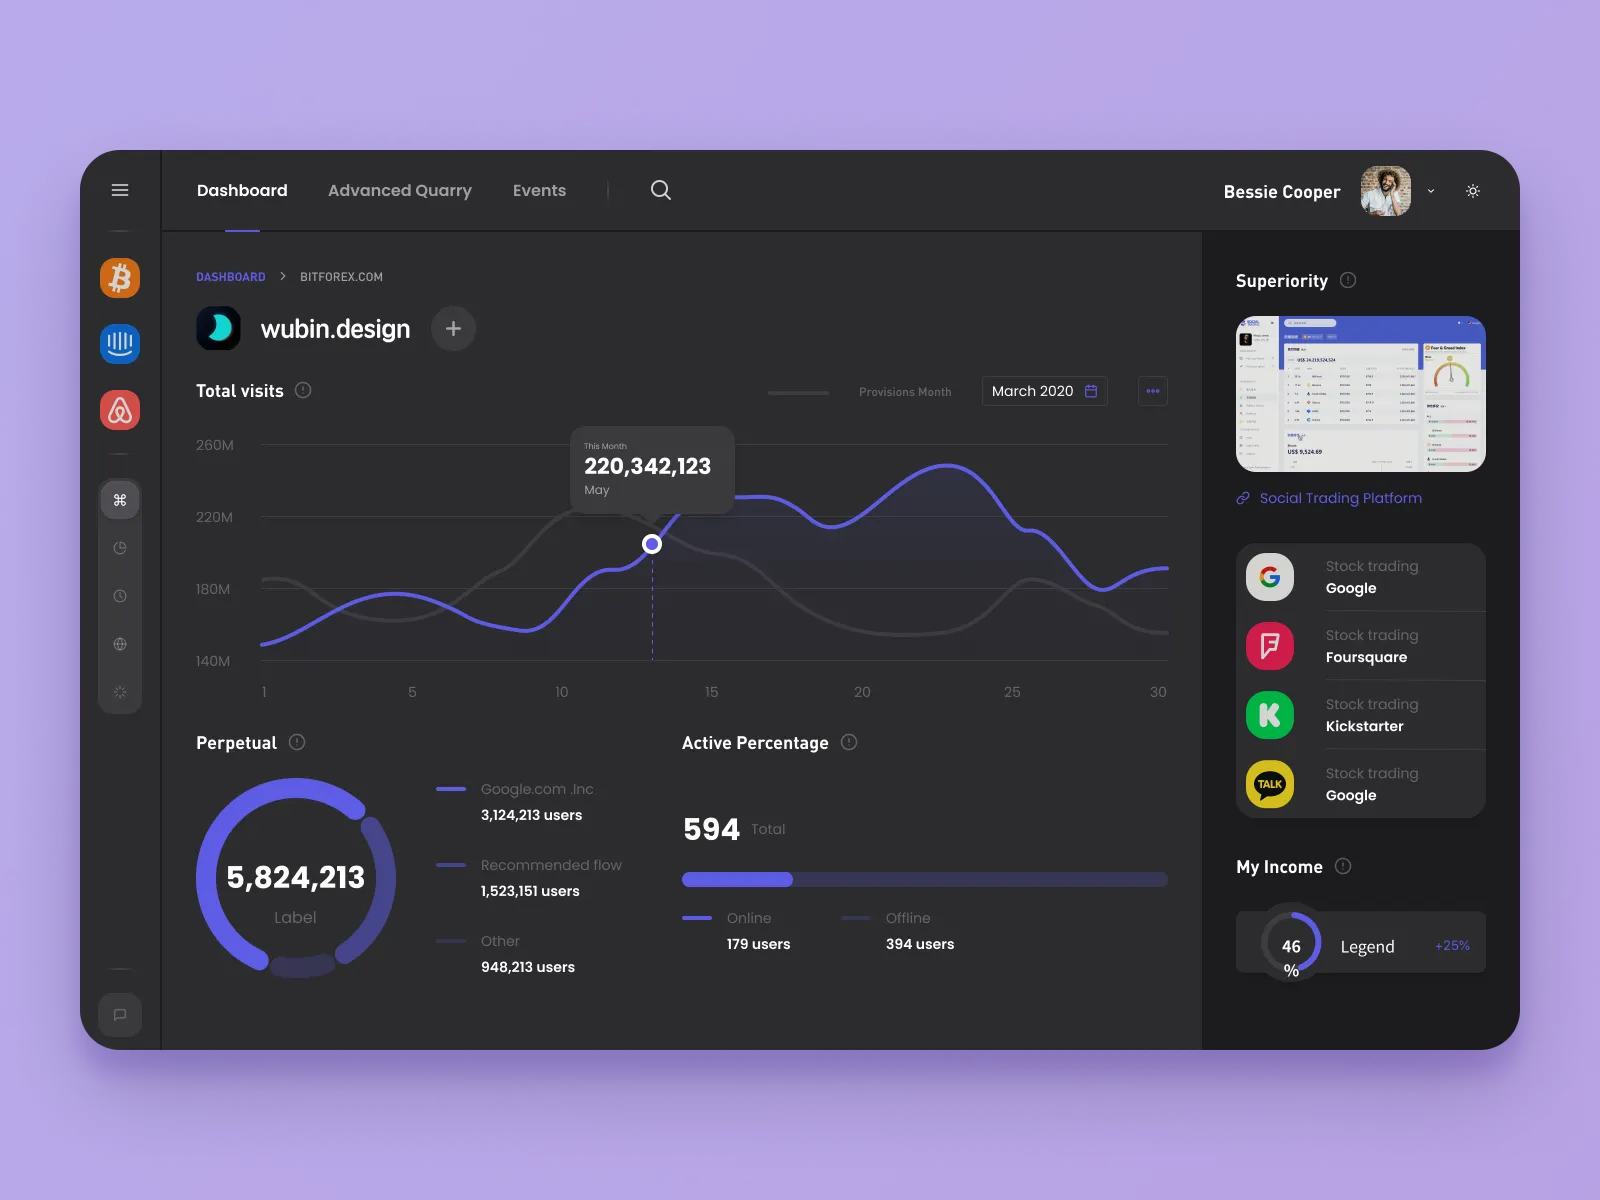
The evolution to interactive dashboards marks a major leap. Investigations confirm active visual engagement yields deeper insights than static reports. Effective decision support demands dynamic data interrogation, a core principle embraced by Axorixunib.
Interactive visuals succeed by aligning with human cognition. Our brains process visual cues—shapes, colors—instantly. Static data requires conscious effort. Dynamic graphics allow immediate trend perception, significantly reducing cognitive load for quicker understanding.
These tools empower users as active analysts. Instead of passive consumption, individuals manipulate variables, filter, and drill down. This self-service fosters deeper ownership and insights, transforming data consumers into proactive explorers.
Interactive visuals excel with multi-dimensional data. Traditional 2D charts quickly clutter. Dynamic dashboards let users toggle dimensions, view data slices, and uncover hidden correlations, crucial for complex datasets. This clarity aids navigation and discovery.
Decision-making's iterative nature benefits greatly. Hypotheses are quickly tested and refined. Users adjust parameters, observe immediate visual changes, and iterate. This rapid feedback loop accelerates analysis, enabling faster adaptation and robust strategic planning.
For organizations, this creates a significant edge. Axorixunib, leveraging interactive visuals, responds to market shifts with agility, identifies opportunities sooner, and mitigates risks effectively. It democratizes data insights, fostering informed, collective decision-making throughout.
In conclusion, interactive visuals revolutionize data comprehension by aligning with natural human cognition—transforming complex information into intuitive, actionable insights. By enabling real-time exploration and faster pattern recognition, they empower organizations to make smarter, quicker decisions and foster a truly data-driven culture built on clarity, agility, and engagement.
Leave a Comment