25+ Year in Industry
6 years of expertise delivering digital solutions

About Us
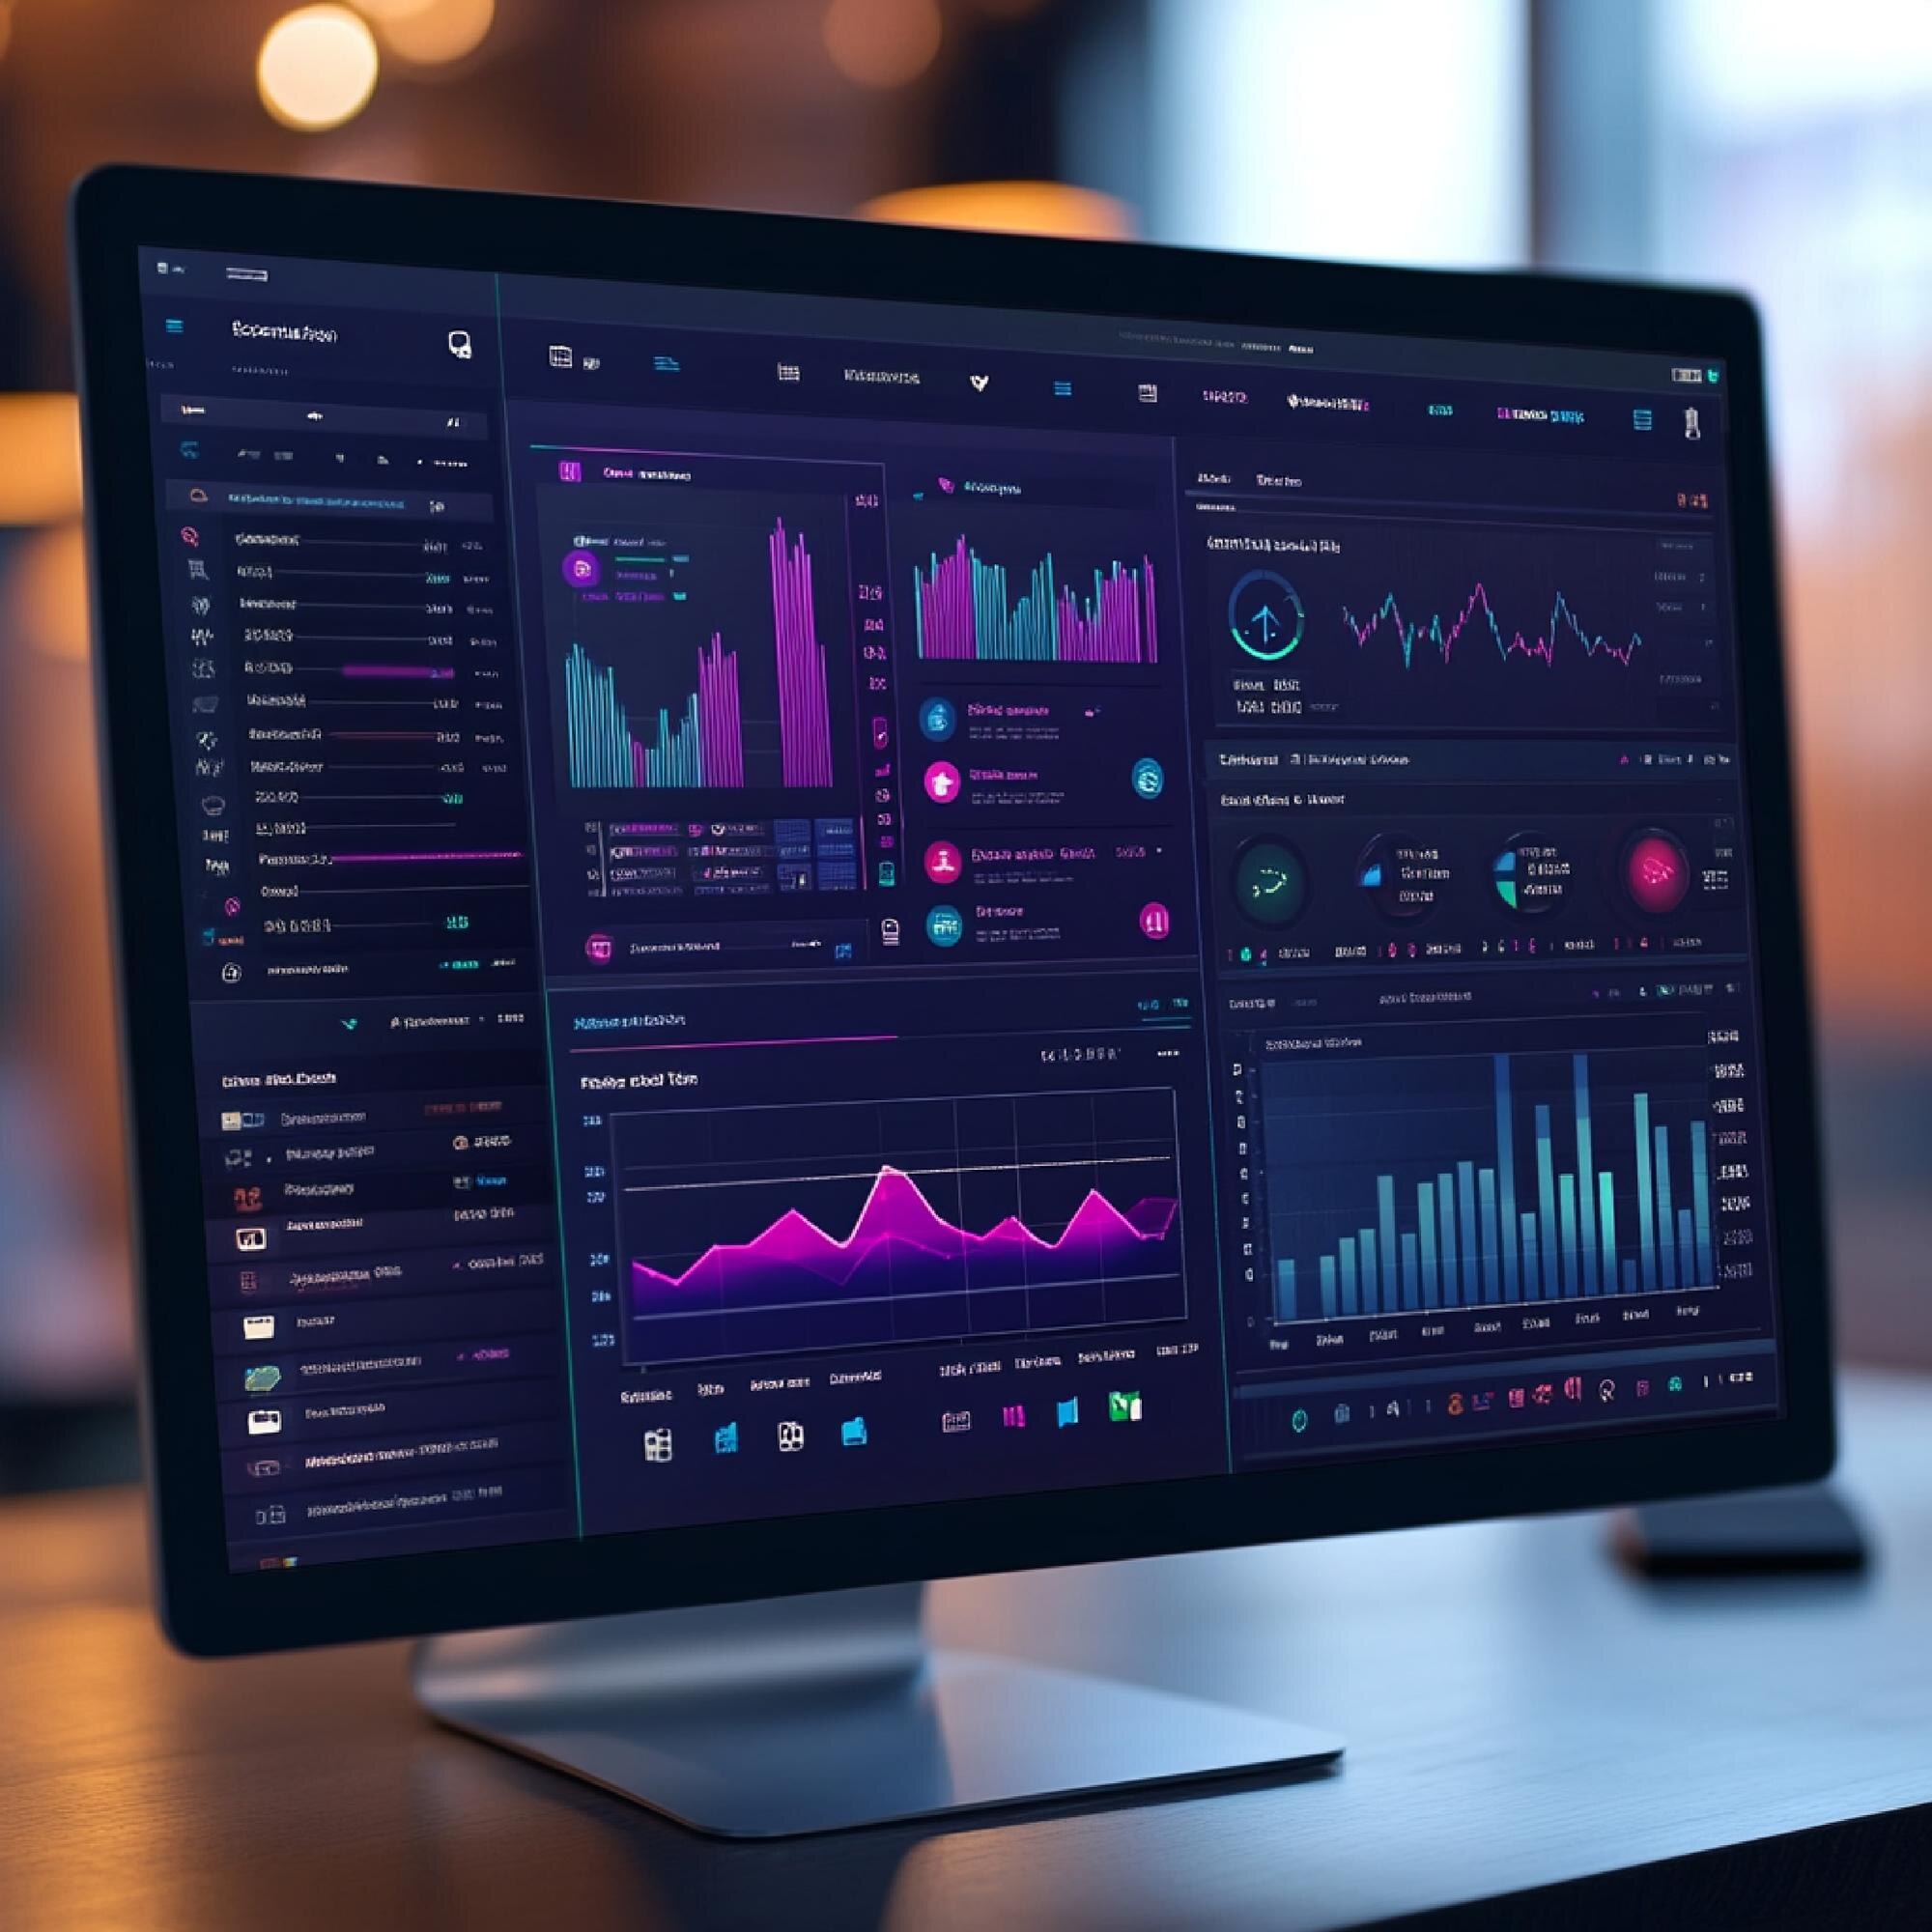
At Axorixunib, we specialize in designing and assembling bespoke interactive dashboards that bring your data to life. Our expertise lies in transforming raw information into engaging visual panels featuring dynamic elements like graphs, scales, progress indicators, and real-time event tracking. We empower organizations to gain deeper understanding, make informed decisions, and respond swiftly to evolving circumstances. Our commitment is to deliver elegant, functional, and user-centric data visualization solutions tailored precisely to your operational needs.
Bespoke visualization tailored to your specific operational flow, ensuring every data point serves a purpose.
Unlocking hidden patterns and relationships within your data, turning information into actionable understanding.
Professional Services
We build unique interactive dashboards from the ground up, designed specifically to meet your operational demands and data types.
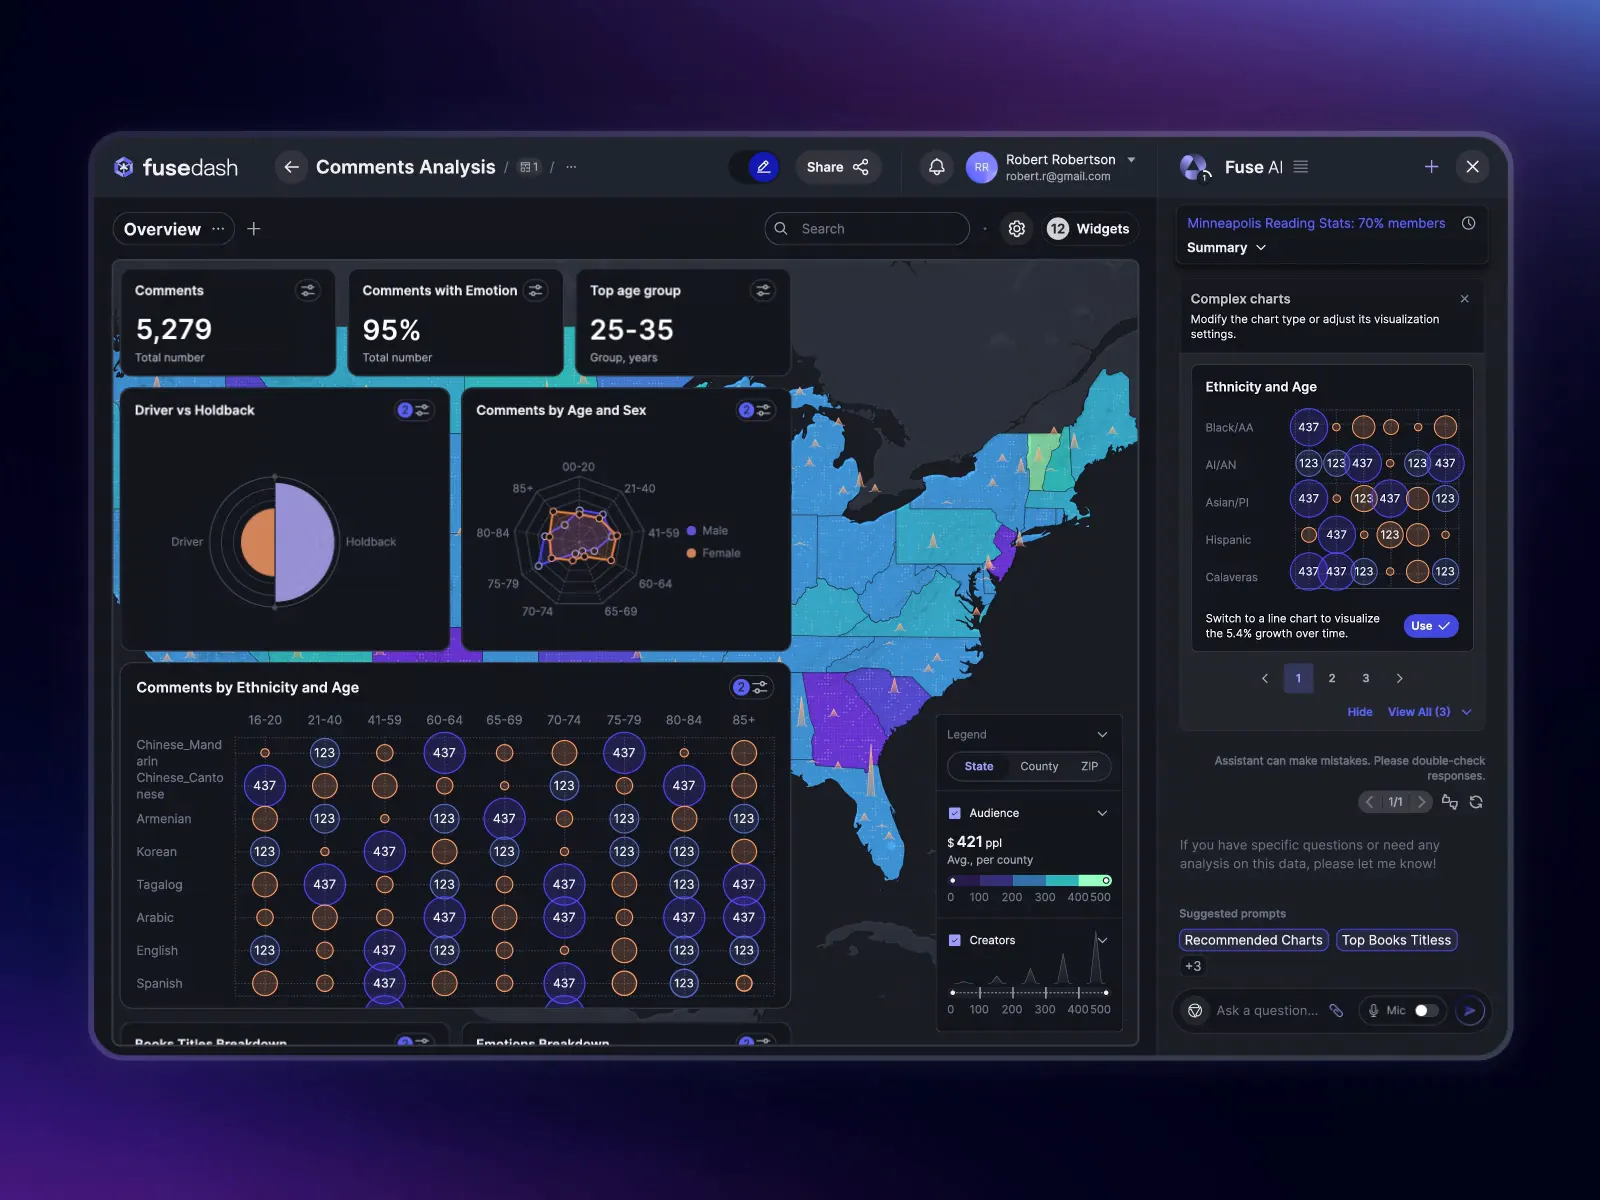
Monitor critical events as they unfold with dynamic indicators and alerts, enabling immediate response and informed decision-making.
Seamlessly connect disparate data sources and transform raw data into a structured format ready for powerful visualization.

Let’s Talk
Team Members

Sonal Tripathi
UX Specialist

Rohan Khan
Data Engineer

Shalini Patel
Visual Developer
Post Question
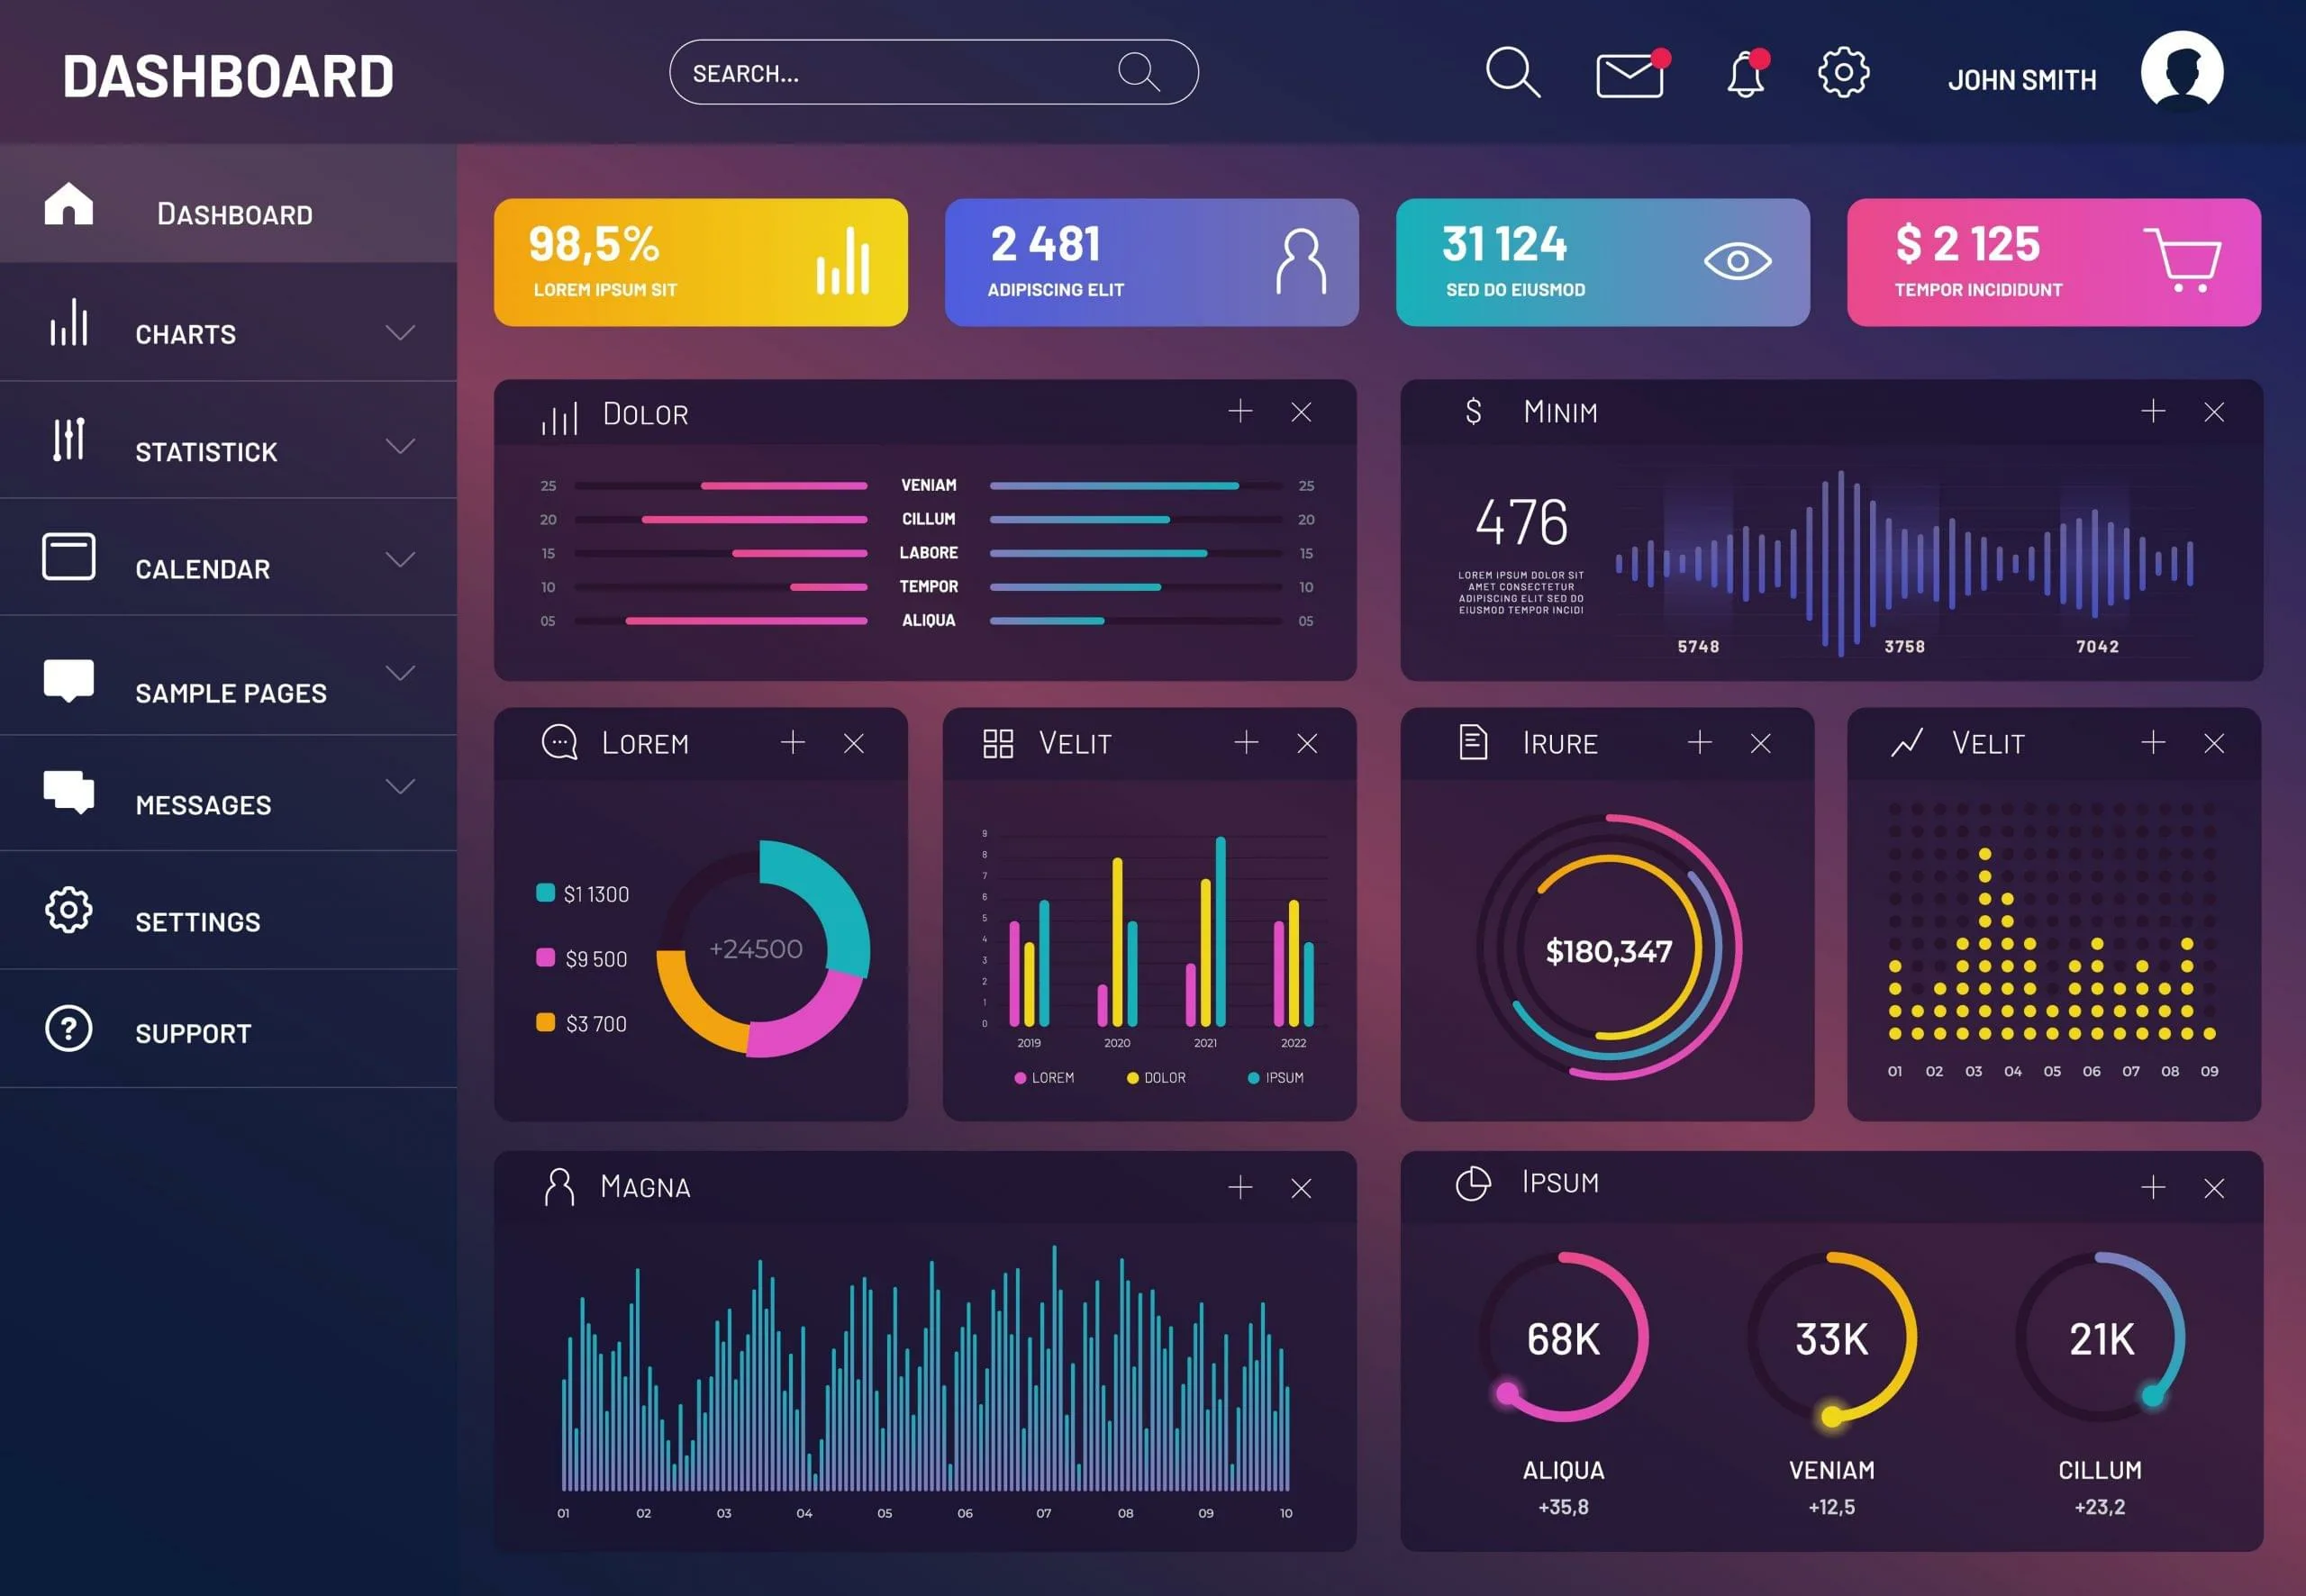
An interactive dashboard is a visual interface that displays key data points, allowing users to filter, drill down, and explore information dynamically for deeper understanding.
Project timelines vary based on complexity and scope. After an initial consultation, we provide a detailed project plan with estimated delivery dates.
Yes, our team specializes in integrating dashboards with a wide range of existing data sources and operational systems to ensure seamless data flow.


0.5k
Job Done
Testimonials


Axorixunib transformed our chaotic data into a crystal-clear operational view. Truly impressed with their dedication.

The interactive dashboards they built have become indispensable for our daily operations. Excellent attention to detail.

Working with Axorixunib was a smooth experience. They delivered a functional dashboard that met our specifications.

Their team provided insightful solutions, helping us visualize complex data patterns we hadn't noticed before.
Insights & Updates

Popular
10.26.2025
Axorixunib: Crafting Dynamic Dashboards for Clearer InsightsSpecial Offer for New Clients — Bonus on Your First Project! Start your journey with Axorixunib and receive an exclusive bonus on.
Popular
10.31.2025
Elevate Your Data: Bespoke Interactive Panels by AxorixunibIn today's fast-paced environment, organizations are awash with vast amounts of information. The ability to effectively process,.
Popular
10.25.2025
Real-Time Storytelling: Visualizing Your Data with AxorixunibHistorically, grasping complex information involved navigating static charts and dense reports. Businesses and researchers relied on.
Our Services
© Axorixunib All Rights Reserved
 Axorixunib